Private Enterprise Research Center, Texas A&M University
Projecting Medicare Spending
The anticipated growth in future federal expenditures relative to federal income is largely driven by elderly entitlement growth. Social Security and Medicare benefits account for the bulk of these entitlements and will grow as a share of the economy as baby boomers transition into retirement. Estimating federal spending on Social Security is much simpler than estimating Medicare spending because Social Security benefits are largely determined by workers’ past earnings so that per-capita program costs rise almost in lock step with per-capita GDP. Thus, if there is no change in the Social Security benefit formula, the future growth in Social Security is primarily a result of increasing numbers of longer-lived retirees relative to workers.
While projected future Medicare spending begins with the same demographic effects as Social Security forecasts, spending per beneficiary is not tied to beneficiaries’ past earnings. Rather, spending is determined by beneficiaries’ demand for the most recent health care technology, within the constraint of Medicare’s insurance package and providers’ willingness to accept the stipulated payments. Thus far, this dynamic has produced spending per beneficiary that grows more rapidly than per-capita GDP.
Importantly, health care spending by non-retirees has also outpaced GDP growth. Such growth is often attributed to two factors. First, rising incomes have allowed the working public to demand quality of life improving health care. Second, increases in the role of third-party payments have separated the act of consuming health care from paying for it. These same factors have contributed to the rising demand for health care by the retired population.
Estimating Medicare spending taking into account the interplay between consumers and suppliers within the constraints of the payment mechanisms would be a difficult task even if the payment mechanisms were constant, but the insurance package is constantly affected by legislative actions, with the Affordable Care Act as the most recent change. Thus, the estimation of future Medicare spending must consider the path that results from the continuation of current law as well as paths anticipated in the event that future legislation trumps current law. Medicare forecasts begin with numerous economic and demographic assumptions. Among other things, productivity, employment, fertility, mortality and immigration assumptions guide the Medicare estimates, but the most important assumptions are the growth rate in per capita health care spending and how the current law affects that growth rate.
Here we compare Medicare spending forecasts made by the Congressional Budget Office (CBO) and by the Medicare Trustees since 2009. While the CBO and the Medicare Trustees spending projections are generally similar over the next two decades, after that, their respective projections diverge with the CBO assuming higher per capita growth rates in the longer run. The passage of the Affordable Care Act dramatically affected both sets of forecasts and these changes show up in the comparison of the 2009 and 2010 forecasts.
Because multiple government entities make long-range forecasts, their projections of the future costs of the Medicare program depend on their assumptions about both future legislation and supply and demand considerations. Importantly, evaluation of any potential Congressional reform begins with a CBO cost estimate derived from the CBO’s baseline forecast. Thus, it is essential to consider how the forecasting assumptions differ and how these differences impact one’s assessment of the program’s fiscal health.
In our review we consider the last four Trustees Reports, 2009 to 2012, as well as the “alternative” long-range Medicare forecasts from Office of the Actuary for the years 2009-2011. A significant change to the 2012 Report is the prominent inclusion of the alternative estimates in the Report rather than in a memo typically posted on the Centers for Medicare and Medicaid Services (CMS) website, as was the case from 2007 to 2011. The Trustees’ estimates are compared to the CBO’s baseline and alternative estimates available in the 2009 to 2011 Long-term Budget Outlook. Taken together, this allows us to compare each entity’s forecasts over time, particularly before and after the passage of the Affordable Care Act (ACA), and then how each entity’s forecast differs in any year. Lastly, we consider the recent estimates of the House Budget Committee’s Medicare premium support proposal.
Medicare Trustees Forecasts 2009 to 2012
The Social Security and Medicare Trustees typically issue their Reports in the spring of each year. This year, 2012, the Reports were released on April 23. The Medicare Trustees Report is developed in association with the Office of the Actuary at the Centers for Medicare and Medicaid Services. Over the past decade, several methods have been used to estimate the Medicare’s long-run costs. Central to the estimates is the assumed growth in per capita Medicare spending. The Reports from 2001 to 2005 assumed the long-run growth per beneficiary Medicare spending, after taking into account age and gender effects, would outpace nominal per capita GDP growth by one percentage point or, GDP+1. This growth rate was assumed to hold in the 25th to 75th year of the projection period, with detailed compositional spending forecasts used in the earlier years.
For the 2006 to 2009 Reports, the projection methodology was modified and allowed for higher per beneficiary cost growth in the initial years of the forecast that slowly declined to per capita GDP growth by the end of the projection. However, the projection for the Hospitalization Insurance portion of the program was benchmarked to the previous projection methodology based on the GDP+1 assumption, so that the present value of its 75-year funding deficit relative to the tax base, the actuarial deficit, was similar across the two methods.
The provisions of the Affordable Care Act (ACA) have been incorporated into the long- range current law projections beginning with the 2010 report, which was only released after the passage of the ACA, to the recently released 2012 Trustees Reports. For the purpose of long-range forecasting of Medicare, the ACA provision requiring that certain payment updates be subject to a productivity adjustment is most important. The required productivity adjustment, based on economy-wide total factor productivity and not health care specific productivity, resulted in forecast spending that was substantially reduced when compared to previous reports. However, the trustees have cautioned that the favorable forecasts depend on adherence to these provisions, which are likely to be overridden by legislative action.
In 2010 and 2011 reports, the long-run cost growth is assumed to be the same. The ultimate current law growth rate across all parts of Medicare results from a provision in the ACA stipulating that payment updates, for much of HI spending and some of the Part B spending in the Supplementary Medical Insurance (SMI) portion of the program, are to be reduced by the increase in the economy-wide multi-factor productivity. When the productivity update, assumed to be 1.1 percent, is netted out of the payment updates, the resulting long-run per capita growth rate for the affected HI and SMI spending categories was GDP-0.1 in the 2010 and 2011 Reports. Further, physician payments under the current law forecasts continue to be constrained by the Sustainable Growth Rate (SGR) mechanism that originated with the Balanced Budget Act of 1997.
The assumptions underlying the 2012 Trustees Report are modified in several ways relative to the previous reports. Following the recommendations of the Technical Panel, the GDP+1 assumption that guides the long-range estimates of Medicare spending before considering the effects of the ACA is modified and increased to GDP+1.4. Also a new model that includes various factors that affect Medicare spending growth is used to produce the growth rates in the later years of the projection.
After taking into consideration the productivity adjustments from the ACA, the ultimate long-range growth assumptions in the 2012 Report for the affected Part A and B services are slightly higher than the growth rates used in preparing the 2010 and 2011 Reports. HI spending the long run is now assumed to grow at GDP + 0.2 rather than GDP+0 assumed in the 2011 Report. Long run SMI Part B spending is assumed to grow at GDP+0.1 in the 2012 report rather than at GDP+0 as in the 2011 Report.
Another significant change in the 2012 Trustees Report is the prominent inclusion of the alternative estimates in the introduction, as the first figure in the Report Figure I.1, as well as in a new section in the Appendix. While the Trustees Reports’ forecasts generally adhere to current law, since 2004, the reports have warned that the estimates of Part B spending likely understate future spending due to the history of legislative overrides of the scheduled Sustainable Growth Rate mechanism. Beginning in 2007, the reports have referenced alternative estimates for Part B that are available on the CMS website. With the 2010 and 2011 reports, alternative estimates for Part A are also available in addition to the alternative estimates for Part B. This year the alternative estimates are incorporated into the main Report.
Congress has consistently overridden the SGR payment restrictions. Given the tendency of Congress to override the spending limits under the SGR and the substantial limits on payments resulting from the new productivity adjustments, the Trustees note in the introduction to the 2011 Report, “We recommend that the projections be interpreted as an illustration of the very favorable financial outcomes that would be experienced if the physician fee reductions are implemented and if the productivity adjustments and other cost-reducing measures in the Affordable Care Act can be sustained in the long range – and we caution readers to recognize the great uncertainty associated with achieving this outcome.”
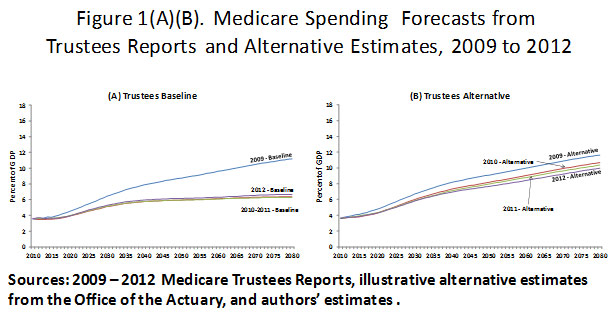
Figure 1 presents the long run Medicare forecasts from the 2009 to 2012 Trustees Reports along with the illustrated alternative projections made in each year. Comparing the baseline estimates from each report, as shown in graph (A), indicates the dramatic reduction in annual spending as a percentage of GDP that occurred between the pre-ACA 2009 report and the post-ACA 2010 reports. The baseline projections for 2010 and 2011 use essentially the same assumptions and result in quite similar long-range spending estimates. Though the long-run assumptions are slightly higher in the 2012 Report, spending as a percent of GDP is similar to the path forecast in the 2010 and 2011 Reports. The major changes in the current law estimates then occur between the pre-ACA 2009 report and the post-ACA 2010 Report. Total Medicare spending in 2010 was 3.6 percent of GDP and prior to the passage of the ACA, Medicare spending was predicted to rise to about 6.4 percent of GDP by 2030 and to 8.7 percent by 2050 based on the 2009 Report. But with the passage of the ACA total “current law” was only forecast to rise to 5.1 percent of GDP in 2030 and 5.9 percent by 2050 based on the 2010 Trustees Report, for a 20 percent and 32 percent drop of spending in those respective years.
The next graph (B) shows the alternative estimates of total Medicare spending as a percent of GDP. The depicted alternative forecast for 2009 assumes that Part B spending will grow with the Medicare Economic Index (MEI) rather than as stipulated with the SGR mechanism. The alternatives for 2010 to 2012 assume that the productivity adjustments affecting Part A and some of Part B spending remain in force for about a decade and are then phased out between 2020 and 2035. The alternative estimates for 2010 to 2012 also assume that the current law SGR updates as applied to physician payments are overridden, and that those payments are updated instead by the MEI. The alternative estimates for 2010 to 2012 are about 30 percent higher than the baseline current law estimates. However, the alternative estimates made in 2010 are only 3.6 percent lower than the alternative estimates for made in 2009. The difference is due to limiting the full impact of the productivity adjustments to the first decade and then the phase-out of the effect on benefits by 2035.
Graph (C) depicts the present value of Medicare spending net of premium spending over the next 75 years as a percent of GDP. The starting year in each case is the year of the Trustees Reports’ publication. The baseline estimates are from the Trustees Reports and the alternatives are estimated assuming the same percentage premiums as in the Trustees Reports. Federal spending on Medicare net of premiums based on the baseline estimates in the 2009 Trustees Report were equal to 6.5 percent of GDP and were 6.7 percent based on the alternative estimates in that year. With the passage of the ACA the baseline estimates dropped to 4.5 percent of GDP, but the alternative estimates only dropped to 6.0 percent based on the 2010 Report. The baseline percentages for the 2011 and 2012 Reports were slightly higher, but the alternative estimates were consistently about 6.0 percent of GDP for the post-ACA reports.
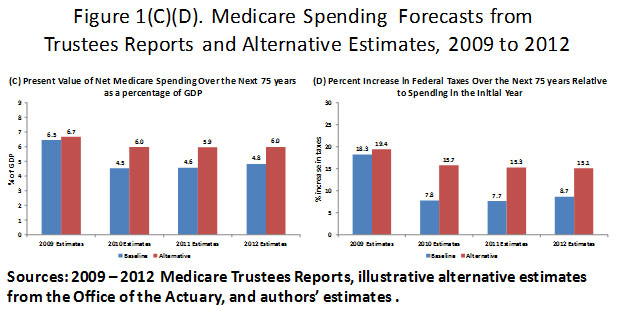
The final graph (D) shows the percentage increase in federal taxes necessary to fund the growth in Medicare relative to the net spending in the initial year of the forecast. Total Federal taxes from all sources have averaged 18 percent of GDP over the past 50 years and in 2009 about 3.2 percent of GDP was already dedicated to Medicare spending net of premiums. The required 6.5 percent of GDP necessary to fund the program over the next 75 years is thus 3.3 percentage points of GDP higher than the spending in 2009. Funding these expenditures will require an 18.3 percent increase in taxes above the historical tax revenues. The pre-ACA alternative estimates from 2009 would require a tax increase of 19.4 percent. The baseline results from the 2010 to 2012 Trustees Reports indicate a 8 to 9 percent increase in federal taxes will be necessary over the next 75 years, while the alternative estimates suggest a 15 to 16 percent increase in taxes due to Medicare growth.
Congressional Budget Office Medicare Forecasts,
2009 to 2011
The differences in the CBO’s and the Trustees’ long-range Medicare spending forecasts are primarily due to the CBO’s higher health care growth assumptions. To see how these assumptions affect Medicare’s size in future years, we again begin with pre-ACA 2009 forecasts, from the Long-Term Budget Outlook in that year and then consider the two available post-ACA forecasts from the 2010 and 2011 Long-Term Budget Outlooks.
The CBO’s 2009 forecasts start with baseline estimates for the first ten years 2009 to 2019 from their March 2009 budget outlook. Then in 2020, the assumed annual Medicare cost growth rate is set to GDP + 2.3 percent. The excess cost growth of 2.3 percent is similar the excess cost growth rate for Medicare between 1975 and 2008. From 2021 to 2083 the excess cost growth rate is gradually reduced to 0.9 percent by the 75th year of the projection. (Recall the ultimate per capita growth rate in the 75th year of the Trustees 2009 projection was GDP+0.) Over the years 2020 to 2083 the average per beneficiary growth rate is GDP + 1.5 percent. The CBO’s alternative forecast assumes that payment rates for physicians grow with the MEI rather than being constrained by the current law SGR mechanism.
The CBO’s long-term Medicare forecast for 2010 incorporated the effects of the ACA along with changes to the initial estimates from which the ACA effects are derived. Like the Trustees, the CBO first forecasts Medicare spending without taking into account the productivity adjustments. These initial forecasts for 2010 are modified in several ways relative to the 2009 forecasts. They begin with the baseline budget projections for the years 2010 to 2020. However, beginning in 2021 the assumed per capita growth rate is set to GDP + 1.7 percent rather than GDP + 2.3 percent, as was assumed in the 2009 Long-Term Budget Outlook. This lower initial excess cost growth is based on the experience from a more recent period 1985 to 2009. Further, this excess cost growth rate is shared with the other programs, primarily Medicaid, rather than being specific to the Medicare program as was the case in the 2009 forecasts. Finally, the initial forecasts also assume that the ultimate per capita growth rate is GDP + 1. Over the final 65 years of the initial forecast, before accounting for the ACA reforms, the average per beneficiary growth rate is about GDP + 1.3 percent or 0.2 percent lower than in the 2009 long-term forecast.
With these initial forecasts in place, the CBO then estimates the effects of the ACA. As in the post-ACA Trustees Reports, the productivity adjustment is the primary driver of the reduction in the baseline forecasts. However, in contrast to the Trustees’ approach that extends ACA’s stipulated productivity adjustment to all future years of the forecast, the CBO limits the time period over which the productivity adjustment actually reduces spending. Altogether, the CBO develops detailed estimates of the ACA on Medicare spending for the first ten years of the projection period, 2010 to 2019 and then a “less precise analysis for the subsequent decade.”
The CBO notes that projecting spending after 2030 involves a great deal of uncertainty, and in those years it is assumed that the growth rates in spending revert to the rate the CBO assumed prior to the passage of ACA. The alternative estimates in the 2010 Long-Term Budget Outlook assume the payments to physicians gradually rise through 2020 rather than being constrained by the SGR mechanism. Beyond 2020 both the SGR mechanism and the productivity adjustments are assumed to no longer affect Medicare spending growth in the alternative estimates. Annual baseline estimates are available to 2035 in the 2010 Long-Term Budget Outlook. In that year, Medicare spending is projected to be 5.9 percent of GDP or about 25 percent less than the pre-ACA forecast.
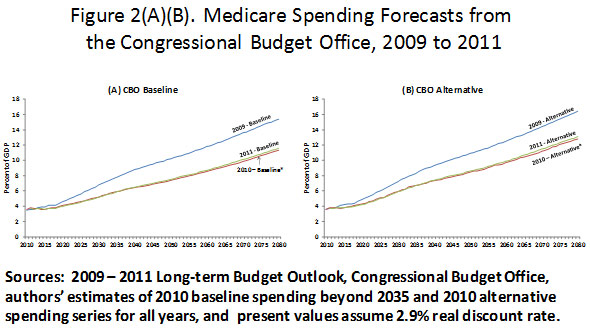
The 2011 Long-Term Budget Outlook employed the same methodology and similar assumptions as used in the 2010 Long-Term Budget Outlook. Given that the baseline estimates beyond 2035 are imputed for the 2010 series, we use the baseline 2009 and 2011 series to compare the CBO’s assessment of Medicare spending before and after the passage of the ACA. Figure 2 presents the baseline and alterative estimates from the 2009 to 2011 Long-Term Budget Outlooks. As was the case with the Trustees Reports, the estimates made in the years after the passage of the ACA indicate substantial reductions in program’s spending in the long run. Projected baseline spending in 2030 from the 2009 Long-Term Budget Outlook was 6.8 percent of GDP, but in the 2011 Long-Term Budget Outlook the projected spending was 5.2 percent or about 24 percent lower. By 2050 the post-ACA 2011 baseline projection was 7.5 percent of GDP compared the 10.2 percent estimate from the 2009 baseline. Much of the reduction, particularly in the earlier years, is due to the effects of the ACA. Recall that the CBO also lowered its initial growth rate assumption, before assessing the additional effects of the ACA and therefore some of the reduction in spending after the 20th year is due to the changed assumption. The relative annual reductions in the alternative estimates were smaller, but still indicate a 2.3 percentage point drop in the share of GDP devoted to Medicare by 2050.
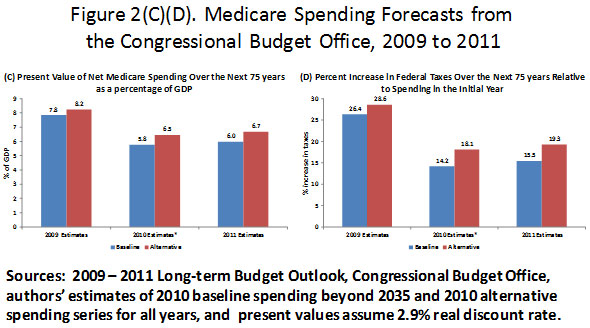
The third graph in Figure 2, (C) indicates the present value of the taxpayer-financed portion of Medicare spending for the next 75 years as a percent of GDP over the same period. The baseline and alternative series from 2009 produce net Medicare spending equal to 7.8 percent and 8.2 percent of the present value of GDP, respectively. The baseline and alternative 2011 estimates are 6.0 percent and 6.7 percent of GDP. Comparing the CBO’s and the Trustees’ estimates made in 2011, we see that the Trustees’ alternative estimates are now quite similar to the CBO’s baseline estimates due to the similarity in the assumptions used in each of these cases. The 2009 and 2011 estimates of the tax increases necessary to fund Medicare depicted in graph (D) indicate the dramatic effect of the ACA combined with the CBO’s lower underlying growth rate assumptions. The baseline estimates of the tax increase necessary to fund Medicare drop from 26.4 to 15.5 percent while the alternative estimates drop from 28.6 to 19.3 percent.
The Trustees’ and CBO’s Estimates
Compared to GDP + x%
As the discussion thus far has indicated, both the CBO’s and the Trustees’ long-range Medicare forecasts include detailed estimates for the first few decades followed by estimates in the remaining years that begin with per capita spending growth that is similar to recent historical growth; and as time goes on the growth rates are reduced. Beginning with these initial estimates, both entities then account for the specific provisions of the ACA, most notably the productivity adjustment and the SGR assumption. The two methodologies then diverge in their assumptions concerning the length of time these expenditure constraints remain in force. The Trustees’ baseline estimates are built on the assumption that the SGR mechanism and the productivity adjustment remain in force indefinitely, while the CBO assumes that after the first two decades the per capita spending growth rate reverts back to the rate that would have existed in the absence of the ACA.
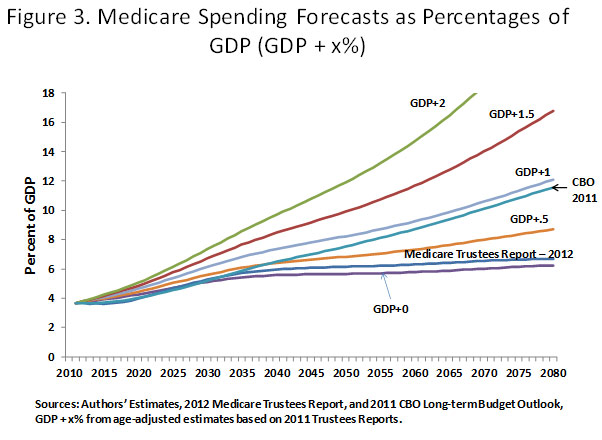
Figure 3 shows that the CBO’s and the Trustees’ baseline estimates are essentially the same for the first 20 years. After that, the differing assumptions result in the CBO spending path being above the Trustees for the remainder of the projection period. In the figure, these two paths are shown relative to the paths that would exist if a constant GDP + x growth rate is applied starting in the first year of the forecast, with x set to 0, 0.5, 1, 1.5, and 2. The Trustees’ forecast is most similar to the path based on the constant GDP+0 assumption, while the CBO’s forecast is most similar to, and reflects the same long run slope, as the series based on the constant the GDP+1 assumption.
Alternative Spending Paths
It is clear that the ACA has substantially affected Medicare spending forecasts, and both the Trustees and the CBO forecast similar baseline spending paths for the next two decades. However, both entities question the likelihood that the reduced spending, relative to previous projections, will be realized. Whether the spending reductions are realized or not, the current law projections reflect an assessment of the desired spending level in a program that is legislatively determined. Figure 4 presents several of the post-ACA forecasts alongside the proposed spending path specified by the House Budget Committee in March of 2012. The 2011 CBO baseline and alternative estimates are presented along with estimates from the two most recent Trustees Reports and estimates from the President’s 2013 Federal Budget released in January 2012.
The path specified by the House Budget Committee’s Chairman, Paul Ryan, and his Staff follows the CBO’s baseline estimates from 2011 to 2022, then in 2023 spending would be estimated separately for beneficiaries who were already enrolled, those born in 1957 and earlier, and those born in 1958 and later. For those already enrolled, net benefits would follow the same growth assumptions used in the CBO baseline estimate. For beneficiaries born in 1958 and later, spending would be set at an age-adjusted amount that would then be indexed to GDP+0.5. Also, the age of eligibility would gradually rise to 67 by 2034. These assumptions produce the net of premium spending estimates depicted in Figure 4. The CBO notes that it “has not analyzed the policies that might be implemented to produce such a path for Medicare spending, including a premium-support approach to Medicare of the sort the Chairman Ryan and other Members of Congress have recently discussed.”
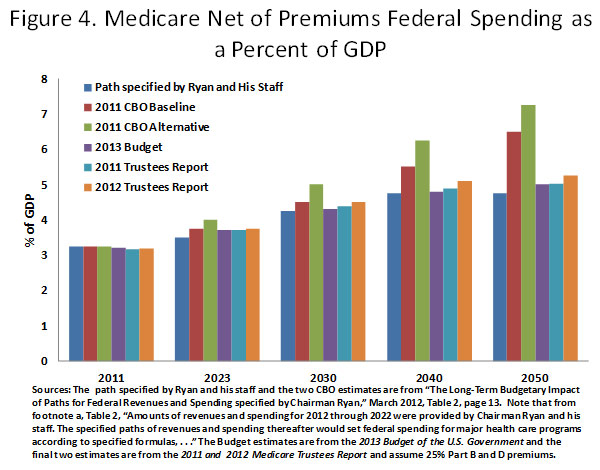
From Figure 4 we see that the post-ACA Medicare spending paths as estimated by the Trustees and as presented in the President’s 2013 Budget are essentially the same as the path specified by the House Budget Committee. While the two sides seemingly agree that the Medicare Budget should be the same, the approach to achieving such dramatic savings is quite different.
The ACA relies on ceilings on provider payments to achieve its expenditure constraints and the Budget Committee’s forecasts rely on premium support payments that are limited to a particular growth rate and on increasing the eligibility age. However, each year since the passage of the ACA, the Trustees have cautioned that future costs will likely to surpass their forecasts. That all health care providers will accept the constrained payments and continue to provide the same level of care to seniors is unlikely, especially as time goes on and payments to providers continue to decline. The ACA essentially attempts to extract all the expenditure reductions from providers. If beneficiaries are restricted from paying providers in addition to the stipulated Medicare payments, then quality of care will decline in an assortment of ways. Allocation of care will be increasingly determined by longer waiting times, facilities will reduce staffing and increase the number of patients per room, more physicians and facilities will not accept new Medicare patients, and in the longer term as the returns to medical educations decline, the quality of health care workers will diminish.
The Budget Committee’s spending path is similar to the spending under the ACA as scored by the Trustees. Its path assumes that the ACA spending constraints remain in place as scored by the CBO until 2023 and then spending follows the CBO’s estimates for those who are born in 1957 and earlier. Thus, most of the members of the baby boom generation, born between 1946 and 1964, are in traditional Medicare and their expenditures in each year are subject to the ACA reforms. The Budget Committee’s premium support payments for future retirees born in 1958 and later grow at the rate of per capita GDP+0.5. Therefore, achieving the spending path outlined by the Budget Committee depends on the ACA reforms as scored by the CBO for individuals born in 1957 and earlier and the premium support payments that grow at the stipulated rate for the individuals born in 1958 and later. As we saw above, the CBO and the Trustees baseline spending paths are similar for the next two decades, then the CBO’s grows more rapidly, so some of the concerns mentioned above concerning access to and quality of care apply to the Medicare payments made on behalf of individuals born before 1958. The ability to supplement one’s premium support payments would allow the individuals born in 1958 and later more flexibility and greater access to care.
Discussion
What is clear from Figure 4 is the possibility of a common goal to reduce Medicare spending growth such that it no longer grows faster than per capita GDP. If such a constraint is realized, Medicare spending will replace a relatively constant percentage of average lifetime compensation for future retirees rather than rising relative to average lifetime compensation as it has for the birth cohorts that have retired up to this point in time. There are definite ways to meet the desired spending path, but out of necessity they must be more flexible than the options currently being discussed, given that the Trustees and the CBO both suggest that realizing the spending paths is unlikely. Several options are outlined below. Assume that all of the options below achieve the same spending path and that path is roughly equal to the most recent baseline estimates presented in the 2012 Medicare Trustees Report. This requires that the reform reduces projected spending by about 20 percent in the 20th year of the projection relative to the non-reformed spending path and by 30 percent by mid-century.
Option 1: Keep the ACA expenditure restrictions in place, but allow retirees to supplement payments to providers. This would constrain taxpayer spending to the estimated levels but would result in greater dispersion in health care spending based on available resources during retirement. As noted in an Office of the Actuary Memo from May 13, 2011, payment rates for inpatient hospital services, under the ACA, would fall to between 50 and 60 percent of the payment rates of private health insurers by 2030 and payment rates for physician services would fall to about 40 percent. This means that the access to health care by retirees who are unable to supplement Medicare’s payments would be limited to providers who are willing to accept the lower payments. This would result in quite different health care consumption across income groups, with the lower income groups having access to insurance that pays providers at rates that are less than Medicaid’s payment rates.
Option 2: Provide risk-adjusted premium support payments and allow retirees to supplement policies. If the risk-adjusted premium support payments are uniform across retirees with different incomes, the disparity in spending by income noted with Option 1 would also be present with this reform.
Option 3: Retain the pre-ACA payment mechanism but require higher premiums including premiums for participation in Part A to achieve the estimated taxpayer financed ACA spending path. This reform would shift the cost to retirees and the premium amounts would rise through time. Uniform premium increases across income groups would again have the greatest adverse effects on low-income retirees.
Option 4: Retain the pre-ACA payment mechanism and increase the cost sharing requirements through higher deductibles and co-pays and tax Medigap insurance to the degree that it increases Medicare spending. As with Option 3, this reform would shift the cost to retirees rather than to providers. Again the distributional concerns remain if the higher cost sharing is uniform across retirees of equal incomes. The advantage of this option is the demand side effects resulting in lower health care spending.
All of the options could produce the desired reduction in taxpayer expenditures, but with undesirable distributional outcomes. The same savings can result under Options 2 through 4 if they are paired with means-testing such that low-income retirees would receive Medicare coverage that is in some way similar to the pre-ACA path. This would require significant reductions in the taxpayer finance Medicare received by higher income retirees. Under Option 2 the premium support amount would be inversely related to income with lower income retirees receiving amounts comparable to the pre-ACA estimates. Under Option 3 the premiums would rise with income and with Option 4 the cost sharing requirements would also rise with income. Some will raise the concern that Medicare’s uniform insurance coverage across retirees of differing incomes accounts for the program’s political durability and that means-testing will reduce the general support of the program. However, to achieve the kind of cost savings associated with the scoring of the ACA, but without the access to care problems that have been routinely noted, significant means-testing is likely.