Medicaid is a joint federal-state health program, primarily for the poor. At the federal level, Medicaid is an entitlement. Each enrollee has a right to benefits. However, federal funds are not distributed equally. Each state determines its own Medicaid spending, but receives federal funds based on a matching formula.
Wealthy states that spend more on Medicaid receive more federal funds, while poor states, which tend to have larger poverty populations, receive less. Why are there such disparities in the Medicaid program, and what should be done about it?
Medicaid and the Affordable Care Act. Currently, as a condition of Medicaid participation, all states are required to extend eligibility to certain “mandatory” populations based in part on the federal poverty level. For a family of four the poverty level in 2011 is $22,350. Mandatory Medicaid coverage includes:
- Children age 6 and older below 100 percent of the poverty level.
- Children under age 6 and pregnant women below 133 percent of poverty.
- Parents who qualify for Temporary Assistance for Needy Families (TANF).
 Additionally, states have the discretion to cover “optional” populations, including older children and adults above 100 percent of poverty, pregnant women above 133 percent of poverty, and low-income parents who are above the state’s TANF income cut-off level.
The Effect of the Affordable Care Act. Beginning in 2014, the Affordable Care Act will expand the mandatory population and require that states make Medicaid available to all individuals, married or single, under the age of 65 with incomes at or below 133 percent of poverty. Although the federal government will provide funds for states to cover this newly eligible population, it will increase the fiscal burden on many states, particularly those that do not already cover expanded optional populations.
- Currently, about half of the states do not cover working parents of eligible children.
- About half do not cover working adults with no dependent children.
- However, Connecticut, Maine, Massachusetts and Vermont cover working and nonworking adults, with and without children, with incomes as high as 300 percent of poverty.
States that enroll newly eligible recipients under the new Affordable Care Act mandate will receive federal funds for 100 percent of the cost of the new enrollees from 2014 to 2016, and then 95 percent of the cost through 2019. After that, however, the states will have to cover much of the cost, though they will receive the traditional federal match to cover these enrollees.
Why Some States Get More Funds Than Others. The federal funding formula is called the Federal Medicaid Assistance Percentage (FMAP). In theory, it is designed to narrow the disparities in the ability of states to fund Medicaid by giving poorer states a higher match for every dollar they spend. However, there is no cap on the amount the federal government matches. Therefore, the more a state spends, the more it receives. In practice, states with above-average per capita incomes are likely to have more expanded Medicaid programs and spend more per recipient. For example, the Kaiser Foundation reports:
- The average total expenditure per Medicaid enrollee in 2007 was $5,163.
- New York, a higher income state, spent $8,450 per Medicaid enrollee in 2007.
- By contrast, Alabama, a lower income state, spent $3,945.
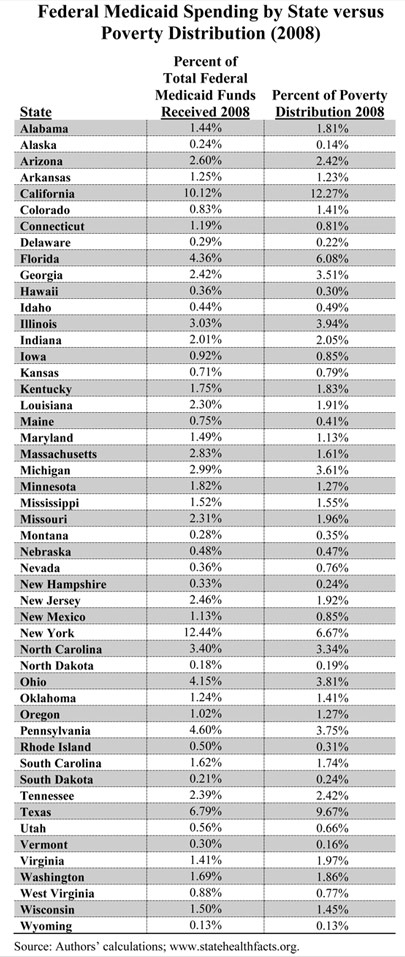 Higher-income states may have a lower per-dollar federal matching rate, but they receive more federal funds because they tend to spend more on Medicaid. In 2008, for example, the federal government distributed more than $191 billion to state Medicaid programs:
- On one end of the spectrum, high-spending New York state receives 87 percent more federal funding than it would based on its poverty population.
- Vermont comes in second, receiving nearly 88 percent more than its share, based on need.
- On the low end, Nevada received only half the distribution of federal funds it would have if the distribution were based on need.
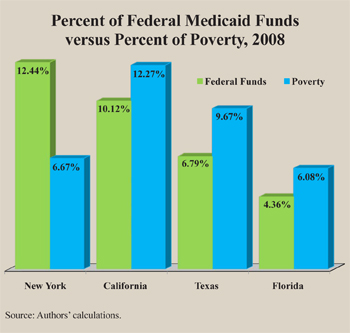
When comparing states with large poverty populations, California, Texas and Florida have a greater share of the total U.S. poverty population than New York. However [see the figure]:
- California has 12.3 percent of the total national poverty population, yet received only 10.1 percent of total federal Medicaid funds.
- Texas has 9.7 percent of the total poverty population, but received only 6.8 percent of federal Medicaid funds.
- Florida has 6.1 percent of the poverty population, but received only 4.4 percent of federal Medicaid funds.
- New York, on the other hand, has about 6.7 percent of the national poverty population, but received 12.4 percent of federal Medicaid funds.
Conclusion. States should have the flexibility to use their federal funds as they choose, and federal funds should be capped at a certain dollar amount. But now that the Affordable Care Act mandates coverage of new populations, states will have to deal with the disparity in the funding formula as well as the eventual burden of providing coverage out of their state budgets to additional enrollees.
Pamela Villarreal is a senior fellow and Michael Barba is a graduate student fellow with the National Center for Policy Analysis.