Using an economic model published in several peer-reviewed journals – a computable general equilibrium (CGE) model – this study examines the effects of a 17 percent flat tax on the various sectors of the economy, on the income of different income groups and on government revenues. The findings are based on a flat tax as proposed in the Freedom and Fairness Restoration Act introduced by Representative Dick Armey (R-TX) and Senator Richard Shelby (R-AL).
Opponents of the flat tax claim that it would impose burdens on the poor, benefit the wealthy disproportionately and increase the federal deficit. However, the findings of the model do not support those objections. Instead, it finds that:
- Every income group would gain, with the greatest gain in percentage terms (7.6 percent) going to the lowest-income Americans; this result holds even though the Earned Income Tax Credit, which now benefits many low-income people, would be eliminated.
- In percentage terms, the gains of the highest income group would be third highest among the six income groups.
- The increased economic activity that would result from elimination of tax variations and from changes in incentives would be so great that government revenues would increase by 1.8 percentage points.
The model divides the economy into 14 production sectors and 14 consumption sectors, then compares relative prices and quantities of the output of the sectors before and after the imposition of the flat tax to see the effects on the various sectors, income groups and government revenue.
It finds that, under a flat tax, every production sector would grow faster than otherwise except for subsidized agricultural crops, which would lose their tax subsidies. The only consumption sector to contract would be consumer financial services, which would be affected because so much of available capital would go to the rapidly growing production sectors.
Further, the model finds:
- The fastest-growing sector of the economy would be savings, which would increase by 7.4 percent more than they otherwise would.
- Although there would no longer be a deduction for mortgage interest, the housing sector would grow by 1.5 percent.
A flat tax would remove existing biases against saving and toward consumption, by removing investment returns from the tax base and by taxing capital and other production inputs at a uniform rate.
[page]The current tax system taxes income inefficiently and causes the national income to be smaller than it otherwise would be in three ways: (1) by failing to tax capital and other production inputs at a uniform rate, the tax system prevents resources from being allocated to their highest valued use; (2) because of exemptions, deductions and loopholes, marginal tax rates on all inputs are much higher than they need to be; and (3) the taxation of investment income leads to a lower capital stock than would otherwise be the case.
These shortcomings have prompted scholars and politicians to propose alternatives to the current tax system. The best known of these alternatives probably is the flat tax. Under a flat tax, all income is taxed at the same rate after a personal allowance is applied. Steve Forbes advocated a flat tax in his campaign for the Republican presidential nomination. Representative Dick Armey and Senator Richard Shelby have introduced the Freedom and Fairness Restoration Act which proposes a flat tax rate of 17 percent with personal allowances of $11,350 for an individual, $14,850 for a single head of household, $22,700 for a married couple filing a joint return and $5,300 for each dependent.1
"Under a flat tax all income is taxed at the same rate after a personal allowance is applied."
Opponents of the flat tax claim that it would impose considerable burdens upon the poor, because it would eliminate the Earned Income Tax Credit, and upon workers, because they would be taxed for benefits including health insurance and the half of payroll taxes currently paid by employers, which are currently tax deductible. They further claim that it benefits wealthy individuals because it would abolish the personal income tax on interest, dividends and capital gains (which proponents view as double taxation because these gains are taxed at the business level); and it would abolish inheritance taxes. Moreover, they claim, the flat tax would increase federal deficits and the national debt.
In recent years, economists have developed a way of calculating the consequences of the complex economic interactions caused by changes in the tax code. The method makes use of a computable general equilibrium (CGE) model.2 Although different scholars use different variations of this model, the core concept is well understood and has appeared many times in the economic literature.3
In this paper, we describe the results of our use of a CGE model to calculate the effects of the flat tax on the various sectors of the economy, changes in the income of different income groups and the effect on government revenues. Our findings, based on levying a 17 percent flat tax as proposed in the Armey-Shelby bill, differ considerably from the pronouncements of those who ignore the totality of economic changes that a flat tax will produce as the effects work their way through the entire economic system.
Our model, which is described in more detail in the appendix, divides the economy into 14 production sectors and 14 consumption sectors. The goods and services consumers buy come from combinations of output from various primary production sectors. For example, the sale of food products to consumers requires outputs from the subsidized crop, other crop, livestock and food processing sectors integrated with outputs from the services sector such as advertising and distribution. The model compares relative prices and quantities of the output of the various production and consumption sectors before and after the imposition of the flat tax rate to see how they change and how the changes interact to cause other changes. In turn, these changes affect the economic welfare of the various income groups, which affects government revenue.
[page]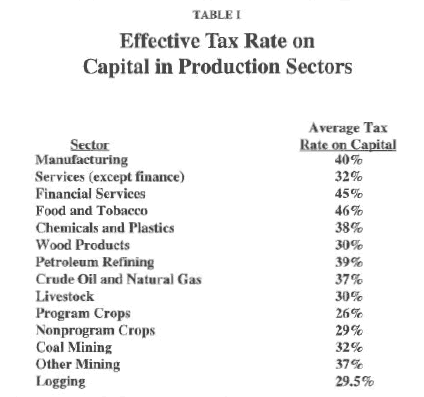
Because there is only one tax rate, because the only exemption is a personal allowance and because all income is taxed only once, the flat tax removes distortions of the current tax system that prevent resources from being allocated to their highest valued use.
Uniform Taxation of Capital Inputs. Under the current tax system, the different marginal tax rates and varying tax treatments cause capital and other inputs to be taxed differently from industry to industry, as Table I shows. Thus, for example, although the average effective tax rate on capital for the overall U. S. economy is 36.4 percent:
- The average rate on capital for the processed food and tobacco production sector is 46 percent, but the rate for tax-subsidized agricultural crops is only 26 percent.
- Manufacturers pay an average rate of 40 percent, but the services sector (other than financial services) pays an average rate of 32 percent.
As a result, there is overinvestment in subsidized crops and in services other than financial services, and underinvestment in processed food and tobacco and manufacturing. The flat tax would move the taxes on inputs closer to a uniform rate, removing the distortions that inhibit the growth of national income.4
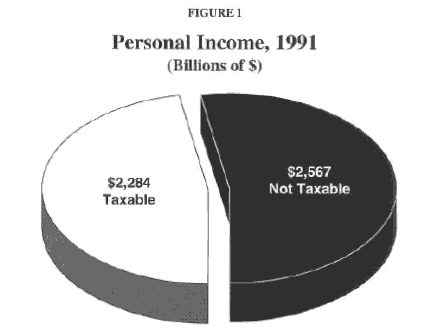
Removing Exemptions, Deductions and Loopholes. As Figure I shows, more than half of all personal income is not taxed under the current system. Under the proposed flat tax reform, except for a personal allowance all income is taxed, but taxed only once, at its source and at one rate. There are no other exemptions, no deductions, no loopholes.
Removing the Anti-Savings Bias. Under our current tax system, people are taxed on what they earn and save, taxed again when the savings earn a return and taxed yet again when they die. Thus the system as it exists is biased against saving and toward consumption, although Congress has passed some special provisions to encourage saving (tax-free retirement accounts, for example). This multiple taxing of investment income has hampered economic growth by causing the United States to have a lower capital stock than it otherwise would have. Under the flat tax, earnings from saved income are not taxed at the individual level. Investment in real capital assets is expensed at the time it is made, rather than being depreciated. Thus the flat tax is pro-saving and pro-investment.
[page]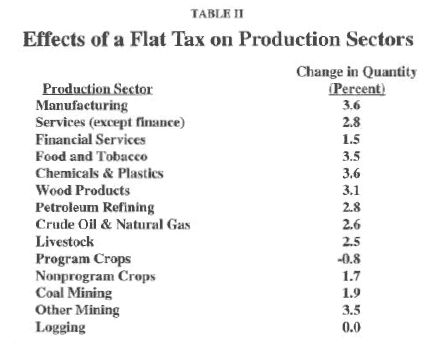
Removing the distortions of the current tax system by replacing it with a flat tax would have a highly stimulating effect on the nation's economy and its output. In addition to removing the distortions caused by inequitable tax rates, the flat tax would result in an increase in disposable income at all income levels, discussed later in this paper. In turn, the increase in disposable income would bring about an increase in consumption across almost all sectors, which would increase the demand for producer goods and services.
Effects on Production. Giving equal tax treatment to all inputs would result in higher growth in every production industry except currently subsidized agricultural crops; the reason in that case is the loss of tax subsidies. As shown in Table II:
- Growth would be especially high in the chemicals and plastic industry and in manufacturing – each more than 3.5 percent.
- The food and tobacco sector and the non-coal mining sector would have increases of almost 3.5 percent.
The increased output in manufacturing, chemicals and plastics, food and tobacco and non-coal mining is especially high because these industries are so important in supplying other industries – most of which also expand to produce consumer goods and services. To illustrate the interaction of these industrial sectors:
- The manufacturing and chemicals and plastics industries supply capital goods that other industries use to produce consumer goods and services.
- The increased output by manufacturing and chemicals and plastics requires more new or refined material from the non-coal mining sector.
In the same way, the increased output in the food and tobacco sector leads to an expansion in livestock husbandry and nonprogram crops – that is, crops that do not receive government tax subsidies, such as fruit, vegetables and nuts. However, output of subsidized crops such as corn, wheat and cotton falls, reflecting the loss of subsidies enjoyed under the current tax code. The loss of subsidies is also the reason for almost no increase in output for the logging sector. The wood products sector, with 3.1 percent growth, will get its raw material from imports.5
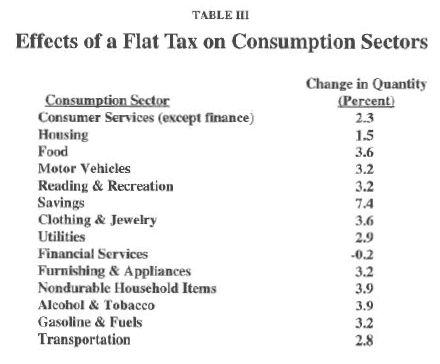
Effects on Consumption. Two consequences of the flat tax – a growth in aftertax income, to be discussed below, and removing the distortions caused by the wide variation in tax rates on producers shown in Table I – lead to a growth in consumption. Obviously the growth in production is fueled by this growth in consumption. The model has 14 consumption sectors, and all but one show growth, mostly between 2 percent and 4 percent. [See Table III.] The exception is the consumer financial services industry, where growth will be slightly negative because so much of the available capital is going to production sectors.
Effects on Housing. Although there will no longer be a deduction for home mortgage interest under the flat tax, the housing sector will grow 1.5 percent more than it otherwise would. This expansion can be attributed primarily to the increase in disposable income of all income groups, which is discussed below.
"Savings will grow by more than 7 percent — more than twice as much as any other sector of the economy."
Effects on Savings. One of the most significant effects of the flat tax is that it will cause savings to grow by more than 7 percent – more than twice as much as any other sector of the economy. This is particularly important because savings are needed to fuel future economic growth. There are two major reasons for the high growth in savings. First, dividends and interest are not taxed at the individual or household level under the flat tax (having already been taxed at the corporate or business level), which encourages real investment in the economy. Second, as we will see, income increases across all income groups under the flat tax, and as incomes increase households save more. This increased saving is measured by the model.6
[page]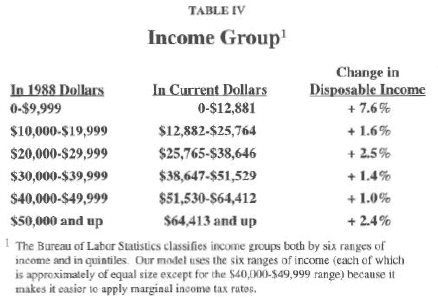
Critics of the flat tax allege that fundamental tax reform would benefit the rich at the expense of the middle class.7 Some maintain that low income families would also be worse off if the Earned Income Tax Credit (EITC) were removed,8 as it would be under the Armey-Shelby proposal or the Hall-Rabushka proposal.
These criticisms, however, are based on a simple-minded application of the tax law to existing incomes. The critics ignore the fact that the flat tax will affect different people in different ways and will effect changes throughout the economic system. We cannot know whether a particular income group would be better off or worse off until we know how that group's aftertax income changes. The model makes it possible to account for these changes, and finds:
- The elimination of inefficiencies produced by the current tax system will cause the economy to be larger than it would be otherwise, and the gains are widely distributed; every income group will gain as a result of the flat tax.
- Among all income groups, the lowest-income Americans will gain the most (in percentage terms) even with the elimination of the EITC.
- In percentage terms, the gains of the highest income group will be third highest among the six income groups.
As Table IV shows, the lowest income group realizes the highest percentage gains from adoption of a flat tax despite the abolition of the earned income tax credit (EITC) under the Armey-Shelby bill. The relatively high 7.6 percent gain to the lowest income group may be explained in part by the fact that this group pays no income tax with the advent of the flat tax. Therefore, this group's aftertax wage rate increases despite a decrease in before-tax wages of one-third of 1 percent, making it willing to supply a larger quantity of labor relative to the upper income groups; and the expansion of virtually all the sectors in the economy means that the lower-income group is able to supply more labor and therefore earn more income.
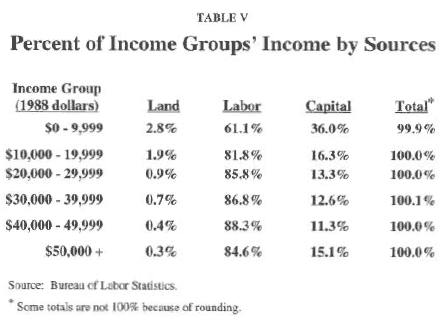
Land, Capital and the Lowest Income Group. An additional and extremely important factor is that the lowest income group receives a relatively high percentage of its income from land and from capital, as shown in Table V. This does not mean that this group owns a large percentage of all land and capital, but rather that the group benefits more than others on a percentage basis from the increase in land rents and in the return to capital after the flat tax is imposed.
The percent of income from capital for the lowest income group may be surprising. It may be due to several reasons. Some in this group are self-employed and take little in salary while ownership of the company yields income from capital; some are retired or semi-retired individuals; and some are temporarily in this group (individuals who depend on interest and dividends that usually would place them in a higher income group).
The second highest percentage gain in disposable income (2.5 percent) is realized by the third lowest income group ($20,000 – 29,999). This is largely an aftertax wage effect. This income group gains considerably from allowances under the flat tax, resulting in a sizable increase in the aftertax wage rate. Hence, individuals in this group are willing and able to supply a larger quantity of labor, and enjoy a relatively high gain in disposable income by doing so.
[page]"Instead of reducing government revenues, a 17 percent flat tax would increase them 1.8 percent."
Our model differs from Treasury Department findings that a 17 percent flat tax would reduce government revenues. We find instead that it results in an annual increase in government revenues of 1.8 percent. The difference probably can be accounted for by the fact that our model allows for behavioral changes resulting from changes in incentives and accounts for effects throughout the economy. It finds that the increase in government revenues is driven by the increases in the majority of sectors in the economy and accompanying increases in employment of labor, capital and land which, in our experience in CGE modeling, are relatively large.
[page]As with any simulation exercise, our results must be regarded with some caution. However, sensitivity tests indicate that our results are robust. This in turn suggests that many of the fears expressed about a flat tax are unwarranted.
[page]- The Freedom and Fairness Restoration Act is based on the ideas of Robert E. Hall and Alvin Rabushka of the Hoover Institution. See their book, The Flat Tax, 2nd ed. (Stanford, CA: Hoover Institution Press, 1995).
- See the appendix for a description of the CGE model we used.
- For example, computable general equilibrium models are discussed at length in J. B. Shoven and J. Whalley, Applying General Equilibrium (Cambridge, U.K.: Cambridge University Press, 1992).
- There would still be some differences in taxes on labor as a percent of labor costs, primarily because of the ceiling on wages taxed for Social Security.
- This study does not report the details of international trade, although the model includes a foreign sector. Details of foreign trade are available from the authors. Here we only note that aggregate imports and exports both increase as the U.S. market expands.
- See M. J. Boskin, "Taxation, Saving and the Rate of Interest," Journal of Political Economy, 1978, 86 pt. 2: S3-S27. We use Boskin's savings elasticity estimates for the various income groups, which average around 0.4, for the CGE simulations reported. Because he found other estimates using other regression specifications, we also tried setting savings elasticities to averages around 0.3 and 0.8 to test the sensitivity of our results. The changes from our original results were negligible.
- For example, at a news conference April 18, 1995, President Clinton said, "All the studies I have seen say that all the proposals out there now will raise taxes for people with incomes under $200,000 and lower taxes for people with incomes over $200,000, like my wife and myself, which would be unfair, and that if they don't do that, they explode the deficit." Washington Post, April 19, 1995.
- From a New York Times editorial on January 18, for example: "Shutting off tax breaks for the poor at a time when Congress is assaulting every spending program for low-income families borders on the unconscionable."
NOTE: Nothing written here should be construed as necessarily reflecting the views of the National Center for Policy Analysis or as an attempt to aid or hinder the passage of any bill before Congress.
[page]How the CGE Model Works
The general equilibrium model is an updated and expanded version of the 1984 based CGE model described in considerable detail in Roy Boyd and D. H. Newman, "Tax Reform and Land-Using Sectors in the U. S. Economy: A General Equilibrium Analysis," American Journal of Agricultural Economics, 1991, 73: 398-409. The model incorporates supply, demand by households, demand by government and a foreign trade sector. On the supply side, total U.S. production is divided into 14 production sectors. The production sectors are: food and tobacco processing; logging; wood processing (e.g., lumber products and pulp and paper); program crops (e.g., corn, wheat, cotton); livestock; nonprogram crops (e.g., fruits and vegetables); financial services; other services; manufacturing; chemicals and plastics; petroleum refining; crude oil and natural gas; coal mining; and other mining. Production functions are nested value-added CES functions with either two or three levels. The production function in the crude oil and natural gas sector treats the oil and gas as a single sector with two outputs and an elasticity of transformation between the two outputs. This is because firms producing these goods produce them jointly and simultaneously. In sectors where land enters the production function explicitly (viz., logging, program crops, livestock, and nonprogram crops), the first-level CES function combines land and capital. Otherwise capital is taken as a primary input. The capital/land CES function is then combined with labor in a second-level CES function. In all CES functions, the inputs have positive substitution elasticities obtained from previous empirical studies. Inputs from the other production sectors enter in fixed proportions, with ratios taken from the national input-output matrix; there is no allowance for substitution among the production sector inputs. These inputs are combined with the capital/land/labor functions in the completed CES function.
The 14 production sectors create 14 commodities. The commodities are: alcohol and tobacco; food; consumer services; housing; clothing and jewelry; reading and recreation; motor vehicles; furnishings and appliances; utilities; gasoline and fuels; nondurable household items; transportation; financial services; and savings. Any given commodity will use inputs from several of the production sectors.
Consumers are divided into six income groups. The groups are (in 1988 dollars): $0 – 9,999; $10,000 – 19,999; $20,000 – 29,999; $30,000 – 39,999; $40,000 – 49,999; and $50,000 and higher. In each group, household utility is a triple-nested CES function. Goods and services enter into the lowest nest. The bundle of goods and services then enter a higher nest which includes the goods/service bundle and leisure. In the highest nest, the goods/service/leisure bundle competes against saving for the consumer's disposable income.
Government utility for goods and services is modeled as a single Cobb-Douglas function. The government obtains its income from its initial endowment and by imposing taxes on output, income, consumption and imports. Thus, for example, the model has the government taxing the various income groups at their (actual) marginal tax rates. The use of the marginal tax rates preserves the incentive structure, but takes too much income away from the consumers. To correct for this, the differences between tax collections calculated using the marginal tax rate and the actual tax collections are added to the consumer's group's income as a lump-sum transfer from government.
A foreign sector completes the model. The foreign sector produces imports and consumes exports. In the foreign sector, we hold foreign borrowing constant.
[page]Barry J. Seldon is Associate Professor of Economics and Political Economy at the University of Texas at Dallas. He has a Ph.D. in economics from Duke University, and previously taught at Ohio University. His publications have spanned a variety of topics from research and development and advertising to public finance, public choice and political support. His research often considers the impact of and private-sector response to public policy.
Roy G. Boyd is Professor of Economics at Ohio University. He received a Ph.D. in economics from Duke University. He was formerly on the faculty of the University of Wisconsin at Milwaukee. In addition to the CGE model of the United States economy, which he originally developed for the U.S. Department of Agriculture, he has also developed models of the national economies of Mexico and the Philippines. His research has often focused upon taxation policies involving natural resource sectors and their general equilibrium effects on other related sectors of the economy.