Social Security is a system in which people pay taxes during their working years and get back benefits in return. Accordingly, there are two interesting questions that can be asked:
- Are the benefits individuals can expect to receive greater than, less than or equal to the value of taxes they can expect to pay?
- Given expected benefits and taxes, what is the rate of return and how does it compare to the return on alternative private investments?
To answer these questions, we have made calculations for individuals born in different years based on their sex, race and marital status. In making these calculations, we estimate lifetime earnings patterns and life expectancies and identify tax rates for people born in different years. We estimate benefits based on Social Security's benefit formulas.
How do we know what expected taxes and benefits are for any given individual? After all, there is some chance the individual could die tomorrow, and some chance he or she could live beyond age 100. To deal with this problem, we have considered all possible life spans and the associated streams of tax payments and Social Security benefits. The expected outcome of participating in Social Security is the sum of all these potential outcomes, each weighted by its probability of occurring.
Present Values for Men. We find that most people who are currently working can expect to receive less in Social Security benefits than they have paid in payroll taxes. And there are differences in how the system affects racial groups. For example, consider people entering the workforce today at age 20:
- A black male can expect to pay $61,645 in Social Security taxes during his working years, but will get back only $20,666 in benefits (where both taxes and benefits are expressed in current dollars, measured at a 4 percent discount rate).
- For this worker, the consequence of participating in Social Security is a net lifetime loss of $40,979.
- By contrast, a white male can expect to pay more than one-third more in taxes ($84,891), receive almost twice as much in benefits ($40,060) and experience a slightly larger net lifetime loss ($44,831).
What explains this racial disparity? It is the outcome of two counteracting factors: one that favors blacks and one that favors whites. On the one hand, black workers are disadvantaged by the fact that they have a higher mortality rate at ever age. For example:
- Among 20-year-old white men, almost 84 percent are expected to reach the normal retirement age.
- By contrast, fewer than 64 percent of 20-year-old black men are expected to live that long.
Thus although he pays the same payroll tax rate while he is working, the average 20-year-old black male can expect to draw fewer monthly retirement benefit checks, on the average. On the other hand, the lifetime earnings of a young black worker are only 78 percent of those of his white counterpart, on the average. And since Social Security's benefit formula favors lower-income workers, it rewards the average black retiree's contributions more than the average white retiree's contributions, other things equal.
Present Values for Women. Because they tend to earn lower wages, women can expect to pay less in Social Security taxes than men over the course of a lifetime. However, since women have longer life expectancies, they can expect to cash more benefit checks. As a result, the expected losses for women entering the labor market today are smaller than for men, although they are larger for white women than for black women. On the average:
- A black female entering the labor market at age 20 can expect to pay $31,913 more in taxes than she will get back in benefits.
- A 20-year-old white female can expect to pay $34,920 more in taxes than she will get back in benefits.
As in the case of the men, white women can expect to live longer than black women. For example, about 90 percent of today's 20-year-old white females are expected to reach the retirement age in contrast to 79 percent of black females. This advantage is somewhat offset, however, by a benefit formula which, as we have seen, favors lower income earnings. On the average, the lifetime earnings of white females are expected to be about 25 percent greater than for black females.
Present Values for Married Couples. Social Security's survivors benefits and spousal benefits make all of these numbers look better – particularly if the workers are married to spouses who never work. For example, a nonworking wife is entitled to a spousal benefit equal to 50 percent of her husband's benefit and, if she survives him, 100 percent of his benefit for the remainder of her life. In this case, Social Security is a better deal, but still not a good one. For 20-year-olds in this case, the net lifetime loss is about $14,000 for both races.
Of course, in today's labor market it is increasingly rare to find women who never work. Typically, those who do not work continuously, work part-time or move in and out of the labor market over the course of a work life. At the time of retirement, these women can claim a benefit based on their own taxes, or a spousal benefit based on their husbands' taxes, whichever is higher – but not both. Since they are entitled to the spousal benefit anyway, women who choose this option get nothing in return for the payroll taxes they have paid.
Changes Over Time. The pattern of net lifetime losses for today's older workers varies somewhat from that for younger workers, with racial disparities increasing for today's middle-aged men, but actually reversing signs among middle-aged women:
- Although for today's 20-year-olds, the net lifetime loss for white males is typically about 9 percent greater than for black males, among 40-year-olds the loss for whites is about one-third greater than for blacks.
- Although 20-year-old white females fare about 10 percent worse than blacks, today's 45-year-old white females fare about 7 percent better than blacks.
What explains these differences in racial discrepancies among different age groups? For men, the answer seems to be that incomes are converging with the passage of time. Among 65-year-olds, the life time earnings of the average black worker are only 71 percent of the average white worker. As noted above, among 20-year-olds, the discrepancy has narrowed to 78 percent. As wages converge, the outcomes will converge as well.
Among women there is a completely different pattern. Relative to black women, white women today are more likely to enter the labor market and remain there than their mothers and grandmothers. For example, although 20-year-old white women can expect 25 percent higher lifetime earnings than their black counterparts, but among 65-year-olds, white women have earned only 92 percent of what black women have earned.
Rates of Return for Men. Although whites typically do worse than blacks when measured in terms of present values, whites actually do better than blacks when measured in terms of rates of return. For example:
- A 20-year-old black male can expect a real rate of return on the payroll taxes he pays of only 0.73 percent; by contrast, a white male can expect a return of 1.82 percent – more than twice as much.
- Of course, in both cases, the return is well below what they should be able to earn by investing in stocks and bonds.
What explains racial disparities in rates of return? As was the case with present value, it is the outcome of conflicting factors. The net result is that:
- Twenty-year-old white males can expect back 47 cents in benefits for every $1 they pay in taxes.
- By contrast, their black counterparts can expect to get back only 34 cents.
But if whites do better than blacks from a rate of return perspective, why do they do worse when measured by present value? One way to think about this result is to note that both white and black workers are receiving a return well below what could be earned on alternative investments. So both sets of workers lose money. However, the present value loss for the average white worker is greater because he is forced to "invest" more dollars in the system ($85,000 in lifetime taxes versus $62,000 for the average black worker.)
Rates of Return for Women and Married Couples. As in the case of present values, women do better than men based on rates of return; and couples with a nonworking spouse do better than singles. Yet in these cases, there remains a racial disparity that favors whites. Specifically:
- A black female can expect a rate of return of 1.7 percent, in contrast to the 2.2 percent expected for a white female.
- A black male with a nonworking wife can expect a return of 2.97 percent, whereas a white male with a nonworking wife can expect a return of 3.46 percent.
Changes Over Time. In general, older generations are receiving reasonable rates of return from Social Security, especially among couples with dependent spouses. For example, married men with nonworking wives retiring at age 65 today can expect a rate of return of 4.43 percent for blacks and 4.35 percent for whites. But almost all future retirees will, on the average, have worse rates of return than they would have received if their tax payments had been privately invested. And because the number of workers paying taxes to support each beneficiary will continue to fall, it is evident that tax rates will have to rise in coming years. Thus it is not surprising that many younger workers view Social Security as an ever-increasing tax burden rather than as an income security program.
[page]Social Security benefits account for more than half of a typical older American's household income. Social Security also provides insurance against death prior to retirement and benefits for nonworking spouses who outlive the beneficiary. Together the retirement pensions, spousal benefits and life insurance provide income security for workers and their families from soon after they enter the workforce until their death or the death of their spouse. The completeness of the coverage and the fact that until now most retirees have received reasonable rates of return on their tax payments help explain why the program has been hugely popular for most of its life.
"Social Security is not an investment, but it can be evaluated as an investment from the individual worker's point of view."
However, with the taxation of benefits, the projected increase in the retirement age and the high level of payroll taxes needed to finance current and future benefits, more people are viewing Social Security as a poor investment. With the diffusion of stock ownership, more taxpayers and recipients have become aware of the rate of returns earned by private investments in stocks and bonds in comparison to the return received on their Social Security taxes.
The bleak projections now published annually by the Social Security trustees indicate that the number of workers paying taxes to support each beneficiary will fall from the current level of about 4 workers per beneficiary to 2 workers per beneficiary. As a result, tax rates will have to rise in coming years. Thus it is not surprising that many younger workers view Social Security not as an income security program, but as an ever-increasing tax burden – with their own Social Security benefits far from certain.
[page]Social Security is an income transfer program in which the taxes paid by today's workers fund the benefits of today's retirees. Since these taxes are not used to buy stocks, bonds or other assets, Social Security is not an investment. Nonetheless, it can be thought of as an investment from the point of view of the individual worker. One way to evaluate an individual's investment in Social Security is to calculate its rate of return. That rate of return can then be compared to the yield on alternative investments.
Another way to evaluate an individual's investment in Social Security is to calculate the value today of expected future benefits minus expected costs, using an interest rate that represents the rate of return that could be earned on the best alternative investment. The resulting figure is called the net present value. If the figure is positive the investor gains; if it is negative the investor loses.
In evaluating the program's investment value, other studies typically treat 40 years of tax payments as the costs and 15 to 20 years of a retirement pension as the benefits. But if a worker dies and leaves dependent children, a few years of tax payments may spawn several years of survivors benefits payments. Or an individual may live well beyond ordinary life expectancy. To deal with this problem, we have considered all possible life spans. The expected outcome of participating in Social Security is the sum of all these potential outcomes, each weighted by its probability of occurring. We have made calculations for individuals at different ages based on their sex, race and marital status. In making these calculations, we estimate lifetime earnings patterns and life expectancies and identify tax rates for people born in different years. We estimate benefits based on Social Security's benefit formulas.
[page]"The Social Security benefit formula favors low-income workers, but high-income workers live longer and collect more benefit checks."
Social Security rewards different groups of workers at different rates in expected and unexpected ways. Although all workers pay the same tax rate during their working years,1 Social Security's benefit formula favors lower-income workers over higher-income workers. It does so by replacing a greater percentage of the preretirement earnings, the lower the worker's income. But lifetime Social Security retirement benefits are contingent on the length of retirement, and people with longer life expectancies typically have higher lifetime earnings. Thus although the benefit formula favors low-income workers, longevity favors high-income workers. These two factors tend to offset each other.
Also, groups with higher mortality rates during their working years benefit more from the life insurance function of Social Security. Survivors benefits and nonworking spouse benefits reward married couples more than singles, and reward single-earner couples more than couples in which both work. Given these offsetting effects, how different groups of workers fare under the system is hard to predict without precise calculations.
[page]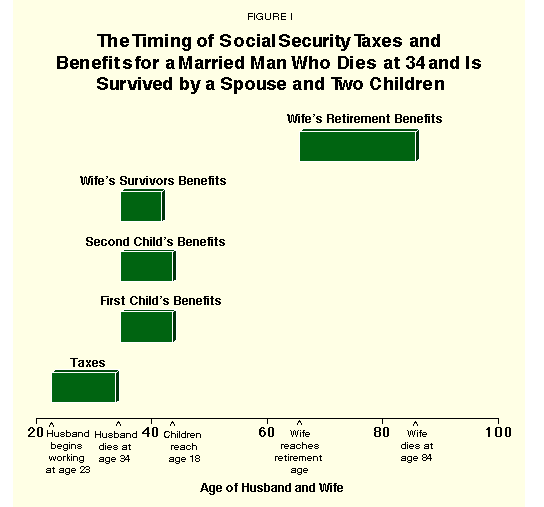
Social Security taxes have three components: Old Age and Survivors Insurance (OASI), Disability Insurance (DI) and Hospitalization Insurance (HI). Together these taxes amount to 15.30 percent of taxable payroll with the Old Age and Survivors Insurance tax accounting for 10.6 percent of payroll. We limit our analysis to the OASI portion of the program because it is possible to isolate its costs – OASI taxes – and its retirement, survivors and spousal retirement benefits.
Eligibility Requirements for OASI Benefits. The primary old age benefits are the worker's own retirement benefits and his or her spouse's benefits. Spouses draw benefits on a worker's account if they do not qualify for their own benefits, having worked fewer than 10 years, or if their own earned benefits are equal to less than 50 percent of their working spouse's benefit.
"Survivors benefits partially offset the loss of retirement benefits for the people who die early."
Survivors Benefits. Accounting for survivors benefits is important, yet it has often been omitted in studies of the Social Security investment due to the difficulty of identifying its impact, particularly of benefits paid after premature deaths. As Schieber and Shoven (1999) point out, supporters of the Social Security program often argue that groups whose members die early in life disproportionately benefit from survivors insurance.2 However, previous studies did not always precisely relate these benefits to the attractiveness of the investment. Our methodology quantifies the effect of survivors benefits on the relative Social Security outcomes for different demographic groups.
It is useful to think of survivors benefits in two parts. First are the benefits resulting from premature deaths or deaths prior to reaching the retirement age.
- In the case of a premature death, each surviving child under age 18 is entitled to 75 percent of the benefit to which the worker would have been entitled based on his or her earnings history.
- A surviving spouse is also entitled to 75 percent of the decedent's benefit as long as a dependent child under the age of 16 is in the household.
- The total family benefit is subject to a maximum that varies but is usually 150 to 180 percent of the decedent's benefit.
Second, and more common, are survivors benefits resulting from deaths after retirement.
- A surviving spouse is entitled to 100 percent of the decedent's benefit if it is higher than the benefit to which the spouse would have been entitled based on his or her earnings history.
- A child under age 18 is entitled to 75 percent of the benefit to which the worker would have been entitled.
- The total family benefit is subject to a maximum that varies but is usually 150 to 180 percent of the decedent's benefit.
Example of Survivors Benefits Before Retirement. Figure I depicts the case of a man who dies at age 34 and is survived by a spouse and 9-year-old twins. The 11 years of tax payments from ages 23 through 33 represent the investment. Each child receives 75 percent of the decedent's earned pension to age 18, and the spouse receives 75 percent of the earned pension until her children are 16 – up to the family maximum. Finally, if the decedent's spouse does not enter the labor force after his death or if the Social Security benefits based on her own earnings are less than the benefits based on her husband's inflation-adjusted benefit, she receives retirement benefits based on his account.
"One type of survivors benefit results from a worker's death before reaching the retirement age."
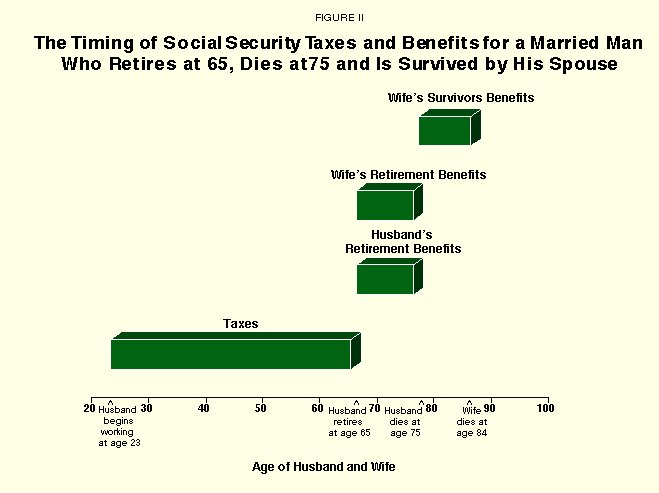
Example of Spouse's Survivors Benefits After Retirement. Figure II presents a more common example of a married man who retires at age 65, lives to age 75 and is survived by a spouse who lives to the age of 84 but has no Social Security pension of her own. Here the investment comprises 43 years of tax payments from the age of 23 to 65. While the worker is living, the couple receives 100 percent of his retirement benefit derived using the benefit formula, plus his wife's retirement benefit equal to 50 percent of his pension. If the worker's spouse outlives him, she is entitled to survivors benefits equal to 100 percent of his pension until her own death.
"A second, more common, survivor benefit results from a worker's death after retirement."
How Social Security Indexes Monthly Earnings. The Social Security Administration (SSA) keeps track of workers' taxable earnings from the time workers enter the labor force until retirement. A worker's initial benefit is calculated by converting earnings in earlier years to dollars comparable to those in the year the worker turns 62, using a national average wage index that is updated annually by the SSA. Earnings beyond age 62 enter the calculation without being indexed. The 35 highest indexed annual earnings are added together and divided by 420, the number of months in 35 years, to obtain the worker's average indexed monthly earnings.
"The benefit formula replaces more of the earnings of low-income than of high-income workers."
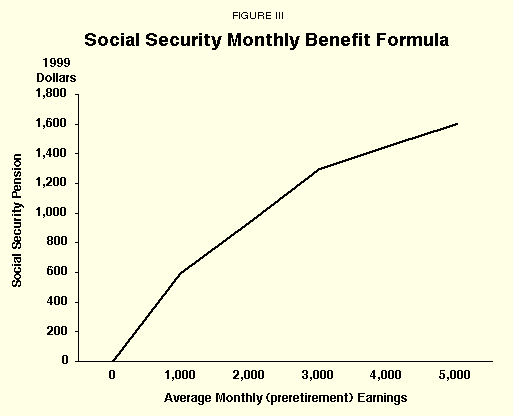
Formula Used to Calculate Benefits. Figure III shows how average monthly earnings are converted to monthly pension payments. As the solid line shows, the worker's initial Social Security pension is computed using a formula that replaces more of the earnings of low-income than of high-income workers.
- This year, retirees receive 90 cents for each dollar of the first $531 of indexed monthly earnings.
- An additional 32 cents is received for every dollar of earnings over $531 and less than or equal to $3,202, and 15 cents for every dollar in average monthly earnings above $3,202.
- Based on this formula, a worker who had average monthly earnings of $1,500 receives a pension equal to $787, replacing 52 percent of earnings.
- If a worker had average monthly earnings of $4,000, he or she receives a pension of $1,452, or only 36 percent of preretirement earnings.
As the examples above illustrate, a well-defined stream of expected tax payments and expected retirement benefits exists for every worker. In each case, it is possible to calculate the internal rate of return and the net present value of the investment. For each individual, Social Security represents a different investment whose attractiveness depends on one's earnings, longevity, marital status, number of children and spouse's longevity.
"This study evaluates Social Security based on the internal rate of return and net present value of the investment."
In this study we analyze Social Security as an investment for individuals based on their birth year, sex, race and marital status. Rates of return and net present values for each group are calculated. Calculating the rates of return and net present values by group requires estimating the size and frequency of each stream of tax payments and benefits. Tax payments are directly related to the group's life cycle earnings and tax rates. Benefits are calculated by applying the Social Security benefit formula to each stream of earnings. Each group's specific mortality determines the magnitude and prevalence of tax payments and benefits. Specifically, retirement benefits are weighted more heavily for groups with longer expected life spans, while the life insurance benefits are more heavily weighted in the calculations for groups with higher mortality rates at younger ages.
Estimating Life Cycle Earnings. Projected life cycle earnings are estimated by applying historical growth rates derived from a Census Bureau data set known as the Current Population Survey (CPS). We use the annual March CPS supplements that include a wealth of labor market information at the individual level.3 The advantage of using life cycle earnings4 is that the average worker in each birth year and racial category progresses through the same inflation-adjusted earning cycle – typified by low earnings when young, rapidly rising earnings up to the middle to late thirties, continued rising earnings but at a lower pace up to the late forties to early fifties, then declining earnings until retirement.5
Economic Assumptions. As noted above, the benefit formula determines how much of an individual's income is replaced. For this study, the future components of the benefit formula are derived using the Social Security Administration's intermediate estimates of wage and price growth. Social Security benefits are also annually adjusted for inflation; we use the SSA's intermediate assumptions for inflation.
Projecting Tax Rates. Historical tax rates are used up to the present, and projected rates from the Social Security Trustees Report are used in future years. Today's older workers faced lower tax rates in their youth, while today's younger workers are likely to face higher rates in the future. The current payroll tax rate of 10.60 percent for OASI is set by law and is not scheduled to change. However, according to the 2000 Trustees Report, Social Security expenses will begin exceeding tax revenues in 2016. Although general tax revenues could be used to make up the shortfall, we assume workers will bear the full burden of financing future benefit payments through an increase in the payroll tax rate. This assumption ignores the redemption of Trust Fund bonds but represents an intermediate case in which each generation bears the burden of the financing shortfall.6
Estimating Longevity. For mortality estimates by racial groups, we need estimates for each birth year from 1935 to 1980 and for both black and white men and women. The Census Bureau has estimated life tables in future years by race and sex. These estimates are the starting point for the birth-year-specific estimates we use. Social Security Administration estimates by birth year are used to supplement the Census data for older individuals.7
[page]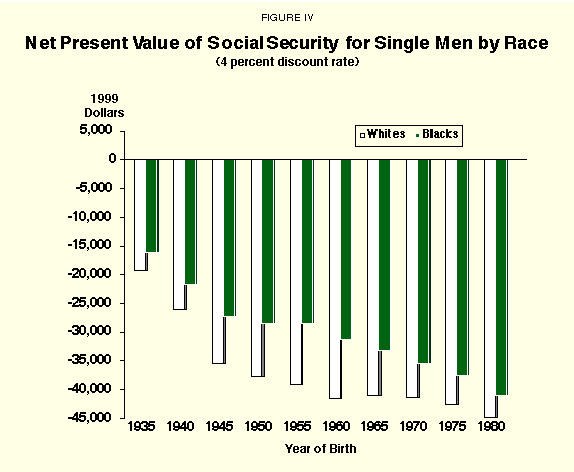
"Virtually all of today's workers can expect to pay more in taxes than they will receive in benefits."
As we have seen, deaths at early ages result in survivors benefit payments to children and spouses based on just a few years of tax payments. Deaths at later ages represent investments that may involve many years of tax payments and such benefits as a retirement pension for the worker, an additional retirement pension for a spouse and survivors benefits. Thus for each possible year of death, there is a well-defined stream of taxes and benefits. To calculate the expected net present value for an individual we multiply the probability of dying at each age times the tax and benefit stream associated with that age. Summing over all possible life spans in this way yields the expected net present value of Social Security. The internal rate of return is the discount rate at which the present values of expected taxes and expected benefits are equal.8
"Even today's 65-year-old men would have done better investing their payroll tax dollars at a 4 percent rate of return."
We use 4 percent as the real discount rate because it represents a conservative estimate of the real rate of return workers could receive elsewhere. Several earlier studies used real discount rates that ranged from 2 percent to 3 percent, while more recent studies have used rates between 4 percent and 5 percent.9 The higher rates are justified for several reasons, including the evidence on the historically higher rates of return on stock market portfolios.10 Using stock market returns from 1802 to 1997, Jeremy Siegel (1998) calculated that for holding periods of 30 years the lowest annualized rate of return was 2.6 percent and the highest was 10.6 percent. Over that same span the average annual real rate of return was 7.0 percent.
"On the average, white males do worse than black males."
Racial Differences in Net Present Values for Single Men. Figure IV summarizes the net present values for single men based on their race and the year in which they were born. All figures are presented in 1999 dollars and are calculated at the age of 25. In this case, there are no surviving children benefits, no spousal benefits and no surviving spouse benefits.11 As a result, deaths that occur prior to attaining the retirement age trigger no benefit stream. The graph has three significant features:
- First, all of the present values are negative. On average, even men born in 1935 (today's 65-year-olds) would have done better if they could have invested their payroll tax dollars at a 4 percent rate of return.
- Second, the present values decline over time, with those just retiring paying $19,485 more in taxes than they can expect to receive in benefits, while those entering the labor market pay $42,762 more in taxes than they can expect to receive in benefits.
- Third, the net present value for single white men is less (that is, more negative) than for single black men. For example, a single black man born in 1980 can expect to pay almost $41,000 more in taxes than he receives in benefits, while a single white man can expect to pay almost $45,000 more in taxes than he receives in benefits.
"The losses for single women are smaller than for single men."
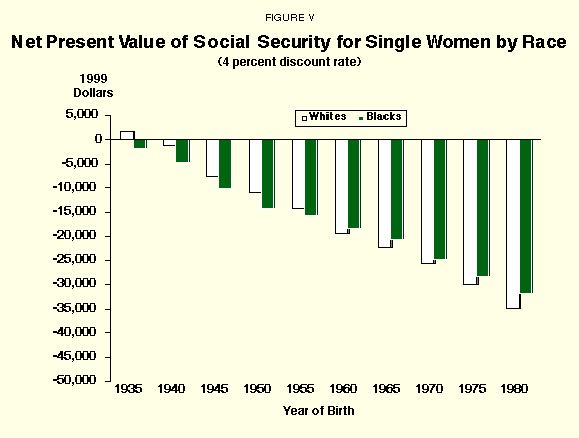
Racial Differences in Net Present Value for Single Women. Some of the same features revealed in the graph for single men also appear in Figure V. From the figure the net present values are negative for all but the first birth year. This means that all groups pay more in taxes than they can expect to receive in benefits. The net present values for single women are higher than for single men. This is due in part to longer expected lives and lower predicted earnings. Longer lives imply more years of receiving retirement benefits and lower earnings are associated with higher replacement rates, both of which work to produce higher net present values.
As the graph shows:
- First, the present values are negative for all single black women, even those born in 1935 (today's 65-year-olds). They are negative for all women regardless of race born in 1940 or later. On average, all of these women would have done better if they could have invested their payroll tax dollas at a 4 percent rate of return.
- Second, the present values decline over time, with those just retiring receiving $883 more in benefits than they paid in taxes, while all those entering the labor market pay over $30,000 more in taxes than they can expect to receive in benefits.
- Third, the net present value for single white women is less (that is, more negative) than for single black women; for example, a single black woman born in 1980 can expect to pay a lifetime tax of almost $32,000 more than she receives in benefits while a single white woman can expect to pay almost $35,000 more.
"Among 20-year-olds, white women lose more than black women, but among the middle-aged, the reverse in true."
Distribution of Benefits Among Retirees, Wives and Widows. Given that most people marry, how closely do the results for single men and single women approximate people's actual experiences?12 Retired workers account for 71 percent of beneficiaries under the OASI program. Of these, women account for 46 percent. About 22 percent of the wives of retired men, or about 8 percent of all OASI beneficiaries, collect retirement benefits on their husband's accounts. So for these women either their benefit amount based on their own earning history was less than 50 percent of their husband's benefit amount, or they did not work enough to qualify for a benefit. The percentage of women receiving benefits based on their husband's accounts has declined and will continue to do so as increasing numbers of women draw Social Security benefits based on their own earnings histories.
"The results for married people will approach the results for single men and women over time."
Widows account for another 13 percent of total OASI beneficiaries. Recall that widows and widowers are entitled to 100 percent of their spouses' benefits after the spouse dies. Thus while a husband and wife are both alive, most beneficiaries draw pensions based on their own earnings, but upon the death of their husbands, women whose own benefits are less than their husbands' will then draw the higher benefits. Together, workers, wives and widows make up 92 percent of all beneficiaries. With the exception of survivors benefits, the realized results for any group of workers will approach the results for single men and women over time, with most members of the group receiving benefits based on their own earnings.
"Among men with nonworking wives, the losses are about the same for young black and white families."
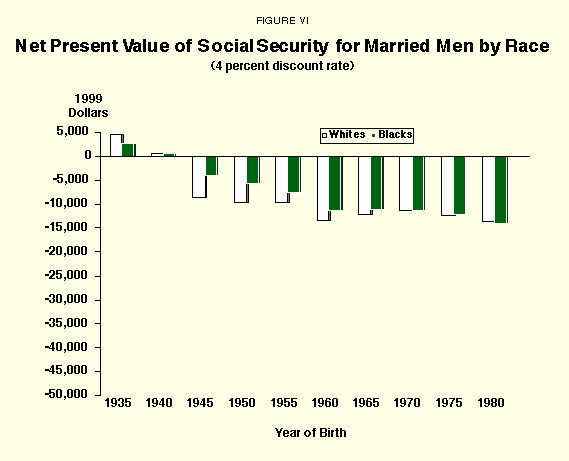
Racial Differences in Net Present Value for Married Men with Nonworking Spouses and Children. Figure VI presents the net present values for married men with nonworking spouses. To make these estimates, we assume that men marry, at age 22, women of the same age. At age 25 we assume the couple has twin children, and we further assume that the wife does not work while the children are 18 or younger. Thus survivors benefits are paid in the case of the husbands' premature deaths between ages 25 and 43.13 These assumptions produce the largest possible net present value. A couple in which both spouses work would have a net present value that falls in between the result for the singles and for the married men as defined here. Relative to the results for single men, the net present values improve significantly because of the survivors benefits and spousal benefits. When the effects of these benefits are included, as depicted in Figure VI, the net lifetime tax has been relatively constant since 1960 at about $13,000.
Racial Differences in Internal Rates of Return for Single Men. The internal rates of return for black and white single men appear in Figure VII. The graph has three significant features:
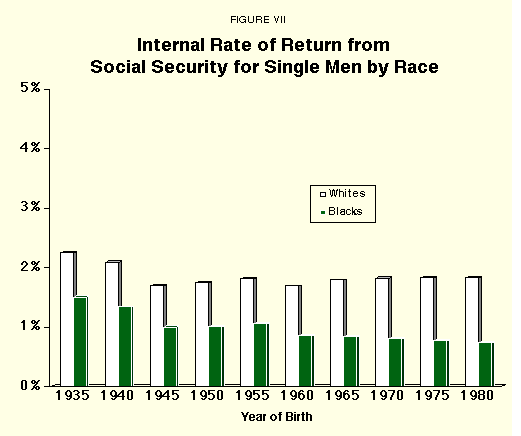
- In general, the returns decline across time and blacks have persistently lower rates of return.
- For men born in 1980, benefits were equal to only 34 percent of costs for blacks but 47 percent of costs for whites.
- Similarly, the internal rate of return for whites is higher – 1.8 percent versus 0.7 percent for blacks.
"Black men have persistently lower rates of return than white men."
How can this be reconciled with the previous results, which showed higher present values for black men? Although projected future earnings are lower for black men and thus a larger percentage of their income will be replaced by the benefit formula, their probability of receiving benefits is lower. The net present values indicate how much an individual loses by participating in Social Security: single white men lose more than single black men. The net present values identify the magnitude of the redistribution. But based on rates of return, which measure the relative progressivity of the system, black men do worse. Here Social Security is regressive.
"Although black women do better than black men, they have lower rates of return that white women."
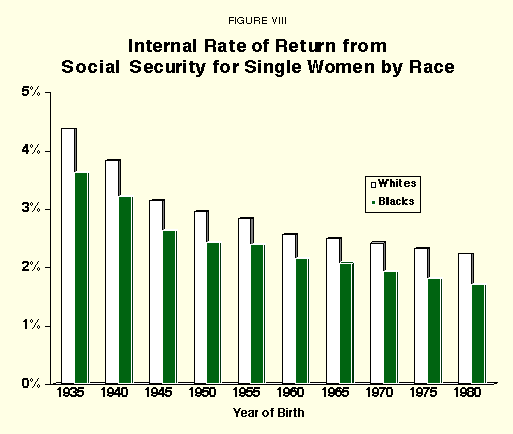
Racial Differences in Internal Rates of Return for Women. Among single women, blacks continue to have a lower rate of return than do whites, as shown in Figure VIII. The graph has three significant features:
- In general, the returns decline across time and black women have persistently lower rates of return.
- Single black women born in 1935 can expect 89 cents in benefits for every dollar paid in taxes, while single white women born in 1935 can expect $1.11.
- Single black women born in 1980 can expect 46 cents in benefits for every dollar paid in taxes, while single white women born in 1980 can expect 54 cents.
- The internal rate of return for blacks born in 1935 is 3.6 percent versus 4.4 percent for whites, and the rate of return for blacks born in 1980 is only 1.7 percent, compared to a rate for whites of 2.2 percent.
"If blacks do better than whites on present values, why do they do worse on rates of return?"
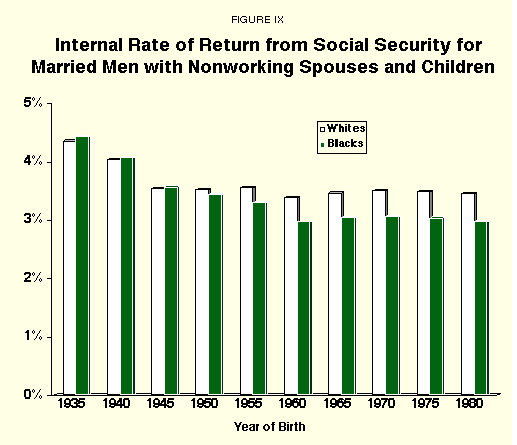
Racial Differences in Internal Rates of Return for Married Men. As Figure IX shows, the rates of return for married men with nonworking spouses and children are quite similar prior to 1950, but from that point on the rates for blacks fall below the rates for whites.
- By birth year 1980 the internal rate of return for married white men is 3.5 percent and the rate for married black men is 3.0 percent.
- Including survivors and spousal benefits narrows the gap between the rates of return to only 0.5 percentage points.
- Given that blacks are more likely to die at younger ages, the inclusion of survivors benefits awarded in the event of preretirement deaths tends to decrease the gap in rates of return.
Finally, the internal rates of return for the 1960 and later birth cohorts are quite similar. The decline in rates of return between the 1935 and 1960 birth cohorts is the result of higher payroll tax rates (and thus higher lifetime taxes) for younger workers and an increase in their retirement age from 65 to 67. The higher retirement age will be fully phased in by the time individuals born in 1960 retire; at this time no further increases in the retirement age are scheduled. Though individuals born in 1965 and beyond will face higher tax rates over their lifetimes, their increased longevity coupled with a fixed retirement age produce relatively stable rates of return.
"Although blacks earn a lower rate of return, they can expect to 'invest' fewer dollars in the system."
As the preceding figures indicate, the attractiveness of Social Security varies over time and between groups. But the graphs present only the bottom line – the net present value or the internal rate of return. The following two tables identify the component parts of the benefits. By looking at them we can more precisely identify how the life insurance and retirement pensions affect the two races' outcomes. Further, the component parts – both taxes and benefits – show that the size of the investment is different for each group.
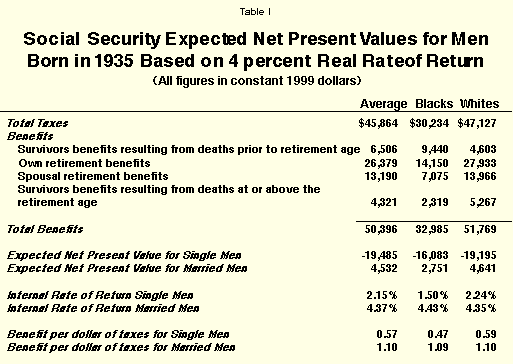
Projected Taxes and Benefits for Workers Born in 1935. Table I presents the components of the net present value calculations for individuals born in 1935. Taxes are listed first. In total, whites pay almost $17,000 more in average lifetime taxes than blacks, paying $47,127 versus $30,234.
Survivors Benefits Before Retirement. Four categories are identified under the benefits heading. The first is benefits arising from preretirement deaths. These benefits are based on our standing assumption that families have two children born when the worker is 25 and that each child and the surviving spouse collect benefits. Survivors of black decedents collect $9,440 and survivors of white decedents collect $4,603. Thus even though black men earn less than white men, their higher mortality at younger ages results in higher survivors benefits.
Retirement Benefits. The next category identifies the individual's own retirement benefits. On average whites collect $27,933 while black retirees collect $14,150. The difference between these benefits and the total taxes produce the net present values for single men previously presented in Figure IV. Single men pay taxes over their entire working life, and the only component of Social Security they collect is their own retirement pension. White single men pay a lifetime tax of over $19,485, while black singles pay a lifetime tax of $16,083.
Spousal and Survivors Benefits After Retirement. The final two benefit components are spousal retirement benefits and survivors benefits that accrue after the worker attains retirement age. The spousal benefits are equal to half of the pensioner's benefit while he is alive. This of course assumes that the wife does not collect benefits based on her own earnings history. The survivors benefits are equal to the pensioner's benefits from the time he dies until the spouse dies. Accounting for all benefits, married white and black men born in 1935 receive a net transfer of $4,641 and $2,751, respectively. By looking at these component parts of the Social Security package, we see that the survivors insurance arising from preretirement deaths tends to favor blacks, but the benefits awarded after reaching retirement favor whites.
"Single black men retiring today will receive 47 cents in benefits for every dollar in taxes, compared to 59 cents for whites."
Table I also reports the internal rates of return and the moneys worth ratios – the percentage of each tax dollar that is returned in the form of benefits. Single black men receive 47 cents for every dollar in taxes and single white men receive 59 cents. For married men the results are similar, with members of both racial groups receiving about $1.10 for each dollar in taxes paid. The internal rates of return are those depicted in Figures VII and IX. For this birth year the rates of return for single blacks and whites are 1.5 percent and 2.24 percent respectively. The rates for married men are almost the same, with blacks receiving a return of 4.43 percent compared to 4.35 percent for whites.
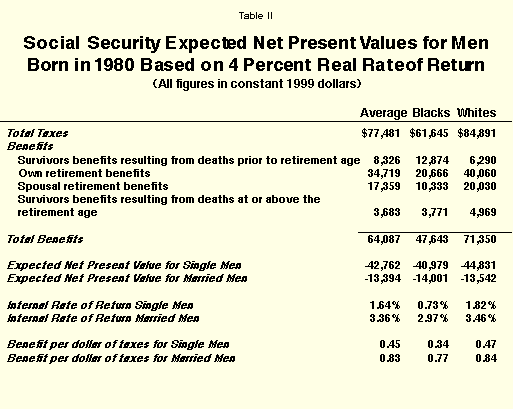
Projected Benefits and Taxes for Workers Born in 1980. Table II presents the results for 1980, the last birth year we analyzed. As in the previous table, differential mortality rates drive the relative distribution of tax payments and benefits.
"Single black men entering the labor market today will receive 34 cents in benefits for every dollar of taxes paid, compared to 47 cents for whites."
Among blacks, benefits to survivors of individuals who die before reaching the retirement age account for 27 percent of all benefits, but for whites these benefits make up just 9 percent of the total. As the numbers show, the net present values and internal rates of return have declined across the board. Again, single black men fare worse than single white men when compared on the basis of the internal rates of return and the benefit per dollar of tax paid. Married black men are expected to receive $0.77 for each dollar in taxes while married whites are expected to receive $0.84. Thus the Social Security investment delivers less than a 4 percent rate of return for both groups and is a poorer investment for blacks with this particular family structure.
It is instructive to consider the relative outcomes when spousal retirement benefits are omitted because their importance will decline with each successive group of retirees as more women's benefits are based on their own work histories. Omitting the spousal benefits causes net present values to fall to -$24,335 and -$33,571 for blacks and whites, respectively. The benefits per dollar of tax paid are almost identical at 0.60.
[page]"Individuals who get a low rate of return would have been better off if allowed to invest their payroll tax dollars."
What then are the implications of these findings? One implication is that groups getting a lower return from Social Security than from private investment would be better off if the Social Security system had never been instituted. This does not necessarily mean that privatizing Social Security – creating individual accounts invested in private capital markets – will automatically produce better returns. The accrued benefits in the old pay-as-you-go system remain a real burden after privatization. In fact, the difference between the lower return of the pay-as-you-go system and the higher return from the private capital market does not matter per se. If on privatization the government honors its promise to older generations and issues them recognition bonds for their accrued benefits in the old system, debt-servicing taxes will have to be raised on the younger generations. When these debt-servicing taxes are taken into account, the higher return on workers' private retirement accounts is exactly compensated for by the taxes required to service the liabilities-turned-debts, resulting in the same low return as in the old system.
The gains resulting from Social Security privatization based solely on a rate-of-return comparison is open to criticism. The criticism applies to the naive argument that the private option is more attractive since the rate of return from private investments is greater than the implicit rate of return offered by Social Security and to the more sophisticated argument that even with the transition cost taken into account the rate of return from investing Social Security contributions in the private sector would be the same as from the pay-as-you-go system.
That is not to say that moving to a private system will produce no gains to American taxpayers. As pointed out by Murphy and Welch (1998), incentives matter.14 One feature of privatization that may change incentives is the use of an alternative tax base during the transition. If, along with creating individual retirement accounts, the government begins to service the accrued Social Security debts with general tax revenues or a new consumption tax with a lower marginal tax rate on labor income, then the adverse consequences of the Social Security payroll taxes will be alleviated. When incentive effects of this sort are taken into account, it is possible to see how privatization can make everyone better off.15
A major implication of differential returns/participation values on Social Security contributions by various demographic groups is that Social Security implicitly redistributes money. From the government's point of view, the current Social Security rules may not redistribute efficiently or as intended. Thus it is important to compare the deals for people of different demographic characteristics in order to assess the direction and degree of redistribution implicit in the system.
Given Social Security's redistributive characteristics across demographic groups, what can we say about the distributional impact of privatizing it? Essentially, forced Social Security participation is a tax on all the demographic groups of later generations judged from their below-market returns. While the ranking by rate of return indicates the progressivity or regressivity of the tax system, the ranking by present value reveals the direction of the intragenerational redistribution. For example, since blacks have higher net present values than whites, we can say the system redistributes from whites to blacks. At the same time, we can say that the implicit tax system is regressive since whites have a higher rate of return (a lower tax rate).
"All things considered, privatization is likely to benefit blacks more than whites."
During the transition to prepaid accounts, the debt servicing tax also implicitly redistributes among various groups. Comparing the progressivity of the current tax and of the proposed debt servicing tax allows us to assess the impact of privatizing Social Security. Based on this principle, we argue that since the implicit redistributive tax of Social Security is regressive in the sense that the tax rate falling on blacks is higher than that on whites and that the likely debt servicing taxes (general income tax or consumption tax) are either proportional or progressive, the distributive impact of Social Security privatization is in favor of blacks.
[page]We have looked at Social Security as a type of investment and have found that it has become less attractive over time. The results we present for single and married workers indicate the range of possible outcomes for members of a given birth year. The return for singles represents the lowest rate of return because all survivors and spousal benefits are forfeited. The return for the married men, because it incorporates spousal and survivors benefits based on a single earner, represents an upper bound for the particular family structure we use. In the future, fewer and fewer families will make it to retirement with only one earner. The true average outcome by race and marital status will fall in the range of results we estimate.
Further, for both races we have used a particular family structure with two children born at the same time. Doing so isolates the effects of Social Security's structure on the rate of return and net present value holding family type constant. Racial differences in the timing of childbirth, the number of children and the labor force participation of women will affect the relative attractiveness of the Social Security investment by group.
Two salient findings emerge from our Social Security rate of return calculations. First, except for some demographic groups belonging to the first two birth years, 1935 and 1940, returns on Social Security investment are significantly below the market alternative of 4 percent for all family types and racial groups. The negative net present values at the 4 percent interest rate indicate the net taxes paid by the different groups of workers. These net tax payments have become larger and larger over time, which suggests that this tax system redistributes from later to earlier generations.
"Virtually all workers today can expect a rate of return from Social Security well below the rate paid by private capital markets."
Since the present values are generally negative, the benefit per dollar of tax paid is less than one. When comparing groups within birth years, several patterns are obvious: (i) women do better than men when measured by both the present value and rate of return, (ii) single-earner couples do better than singles and (iii) blacks do better than whites by net present values but whites do better than blacks by rate of return.
NOTE: Nothing written here should be construed as necessarily reflecting the views of the National Center for Policy Analysis or as an attempt to aid or hinder the passage of any bill before Congress.
[page]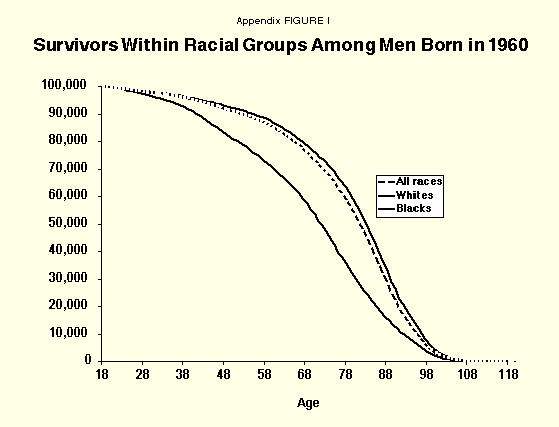
Estimates of Future Earnings. Our forecast of future taxable earnings follow a methodology described in detail in Rettenmaier and Saving (2000).16 In short, the real growth rates in the component parts of annual earnings are calculated for each group of workers, where group defines age, education, sex and race. The component parts of annual earnings for a group are the percentage working, their annual hours of work and their hourly wage. Growth rates for each earnings component are estimated using inflation-adjusted data from the Current Population Surveys.
The calculated real growth rates then become the basis for projecting earnings into the future. Historical taxable income by race, sex and birth year comes from the Current Population Surveys. In previous work we forecasted the earnings subject to the Medicare payroll tax and since the Medicare tax applies to all labor earnings, historical earnings were not capped at some maximum prior to calculating the growth rates. In the present study, the current Social Security taxable maximum was inflation adjusted and retrospectively imposed on earnings in earlier years.17
Longevity Estimates of Racial Groups. The longevity estimates for racial groups in the birth years of interest begin with the U.S. Census Bureau's 1995, 2005 and 2050 middle series life tables.18 The tables are organized by single years of age, by sex, by race and by Hispanic surname. They provide expected mortality at each age in the three cross sections. However, we are interested in the mortality experienced by individuals born in a given year, not mortality in a given year at various ages. To create life cycle mortality tables we use linear interpolation to fill in the cross-section life tables for intervening years. From the entire set of cross-section life tables we identify the experience of the individuals born in the years under study.
Individuals born in 1935 through 1980 are the focus of our study; the interpolated Census data result in mortality estimates for those born in 1935 from age 60 to age 100. For the youngest birth year, 1980, the Census data cover mortality rates between 15 and 70 years of age. Extrapolated data are used for the years 2051 to 2080, which allows us to track mortality out to age 100 for the youngest birth year.
Death registration data for years prior to 1995 show the number, race and sex of survivors for every fifth year of age at 10-year intervals between the turn of the century and 1996.19 Mortality rates between ages and the years 1940 to 1980 is interpolated to fill in the pre-1995 data and complete the cross-sectional life tables from which the birth year life tables are constructed. Birth year-specific Social Security life tables are used to extend the data beyond 100 years of age.20
Appendix Figure I presents the number of survivors, conditional on reaching 18 years of age for white, black and all men born in 1960. By the normal retirement age of 67, 79.9 percent of white men are expected to be alive, 59.5 percent of black men are expected to be alive, and 77.6 percent of men of all races are expected to survive. For that birth year the Social Security Administration expects 76.3 percent of the men who survive to the age of 18 to survive to the age of 67, 1.3 percentage points higher than the estimates based on the Census data. For more recent birth years the Census Bureau data consistently produces longer life expectancies and ultimately higher rates of return than result from the Social Security Administration data. The Census Bureau produces separate mortality tables for blacks and whites, which show a gradual convergence in longevity, so we opt for the Census estimates throughout.
[page]- However, because lower-income workers typically have less education, they spend less time in school, enter the workforce earlier and thus spend more years paying taxes than the higher-income worker.
- Sylvester J. Schieber and John B. Shoven, The Real Deal: The History and Future of Social Security (New Haven, Conn.: Yale University Press, 1999), p. 227.
- In the years covered by the CPS, 1963 to 1997, actual average historical taxable earnings for each group are used. For example, the actual earnings of individuals born in 1940 are known from the year they turned 23 until age 57. The appendix briefly describes how we estimate life cycle earnings for each birth year, but the details appear in Andrew J. Rettenmaier and Thomas R. Saving, The Economics of Medicare Reform, Upjohn Institute for Employment Research, 2000 (forthcoming).
- Other studies have used annual average Social Security earnings or some multiple or fraction of average earnings to represent the historical and projected experience of workers. Using the average, which is based on all workers – young, middle-aged and old – overestimates earnings when workers are young and underestimates earnings when workers are in their prime earnings years. Using a fraction of the average in each year to represent lower-income workers does not allow for the natural progression to higher incomes. Using a multiple of the average to represent higher-income workers suffers from the same shortcomings.
- Because the average group member is the unit of observation, average earnings reflect those of all members of a group, including workers and nonworkers. Mortality rates are based on the same reference point. Thus the results we obtain are representative of the outcomes for the average individual in a birth year by racial group.
- Redemption of Trust Fund bonds means that the Treasury will have to collect additional revenues in the amount of the shortfall or increase debt or that Congress will have to reduce other government expenditures. Each option spreads the burden of financing Social Security across generations in a different way. Collecting additional general income taxes or reducing other government expenditures results in retirees' bearing some of the burden. This would effectively reduce their benefits, lowering their rate of return. The consequences of increasing the explicit debt to finance the redemption of the Trust Fund bonds are more difficult to pin down. In the simplest case, borrowing shifts the burden to future generations. However, if taxpayers care about their offsprings' futures, they will recognize that the issuance of additional debt will burden their children. As a result they will leave them a larger inheritance, consuming less and saving more in order to do so. The latter situation results in an increased tax burden that is equivalent to the case of a general tax increase.
- See the Appendix for a description of how we arrive at our mortality estimates.
- A detailed description of the methodology can be found in Liqun Liu and Andrew J. Rettenmaier, "The Social Security Investment," Private Enterprise Research Center Working Paper #0010, 2000, available at http://www.tamu.edu/perc/0010.htm.
- A real rate of 3 percent was used by Michael J. Boskin, Laurence Kotlikoff, Douglas J. Puffert and John B. Shoven in "Social Security: A Financial Appraisal Across and Within Generations," National Tax Journal, March 1987. C. Eugene Steuerle and Jon M. Bakija, "Retooling Social Security for the 21st Century," Upjohn Institute Press, 1994, used a 2 percent real rate. However, a 4 percent real discount rate was used in a recent study by Julia Lynn Coronado, Don Fullerton and Thomas Glass in "The Progressivity of Social Security," NBER Working Paper No. 7520, February 2000, National Bureau of Economic Research. The generational accounting literature has often used a 5 percent real discount rate as pointed out in Alan Auerbach, Laurence Kotlikoff and Willi Leibfritz, eds., Generational Accounting Around the World (Chicago: University of Chicago Press, 1999).
- See Jeremy J. Siegel, Stocks for the Long Run (New York: McGraw-Hill, 1998), for analysis of the real rates of return of stocks held over long periods.
- We also ignore the small death benefit.
- For purposes of these estimates we have assumed that single and married individuals in each birth year have the same life cycle earnings. This assumption overestimates the earnings for single men, who typically earn less than their married counterparts. On the other hand, single women have a stronger labor force attachment than married women and typically earn higher wages. This implies that our estimates overstate single men's earnings and understate single women's.
- Note that spouses collect benefits on their husbands' accounts. And we assume postretirement surviving spouse benefits are collected up to the normal life expectancy of women in the same birth year conditional on reaching the age of 25.
- Kevin M. Murphy and Finis Welch, "Perspectives on the Social Security Crisis and Proposed Solutions," American Economic Review, May 1998.
- See Martin Feldstein and Andrew Samwick, "The Economics of Prefunding Social Security and Medicare Benefits," National Bureau of Economic Research, NBER Working Paper No. 6055, June 1997; Laurence Kotlikoff, "Simulating the Privatization of Social Security in General Equilibrium," in Martin Feldstein, ed., Privatizing Social Security (Chicago: University of Chicago Press, 2000); and Liqun Liu, Andrew J. Rettenmaier and Thomas R. Saving, "Constraints on Big-Bang Solutions: The Case of Intergenerational Transfers," Journal of Institutional and Theoretical Economics, March 2000, for discussion of Pareto-improving privatization of Social Security.
- Rettenmaier and Saving, The Economics of Medicare Reform.
- See ibid. for a comparison of growth rate options and specific assumptions about how we dealt with several details that arise in forecasting earnings.
- Population Projections of the United States by Age, Sex, Race, and Hispanic Origin: 1995 to 2050 – Middle Series, Vital Rate Inputs, United States Bureau of the Census, Population Division (1996).
- Death registration data from Robert N. Anderson "United States Abridged Life Tables, 1996," National Vital Statistics Reports, December 24, 1998, Vol. 47, No. 13, Table 4, pp. 11-15.
- Felicitie C. Bell, Alice H. Wade and Stephen C. Goss, "Life Tables for the United States Social Security Area 1900-2080," Actuarial Study No. 107, U.S. Department of Health and Human Services, Social Security Administration, Office of the Actuary, August 1992.
Dr. Andrew J. Rettenmaier is the Executive Associate Director at the Private Enterprise Research Center at Texas A&M University. His primary research areas are labor economics and public policy economics with an emphasis on Medicare and Social Security. Dr. Rettenmaier and the Center's Director, Thomas R. Saving, have presented their Medicare Reform proposal to U.S. Senate Subcommittees and to the National Bipartisan Commission on the Future of Medicare. Their proposal has also been featured in the Wall Street Journal, New England Journal of Medicine, Houston Chronicle and Dallas Morning News. Dr. Rettenmaier is the co-principal investigator on several research grants and also serves as the editor of the Center's two newsletters, PERCspectives on POLICY and PERCspectives. He is co-author of a book on Medicare, The Economics of Medicare Reform, forthcoming (2000), and is an editor of Medicare Reform: Issues and Answers, the University of Chicago Press (1999).
Dr. Liqun Liu is an Assistant Research Scientist at the Private Enterprise Research Center. His primary research areas are taxation analysis and evaluation of government expenditures. His current focus is on the effects of reforming elderly entitlements. Dr. Liu serves as an investigator on several research grants. He has papers published in National Tax Journal, Economic Inquiry, Journal of Institutional and Theoretical Economics, and Review of Economic Design.