The 2004 Medicare and Social Security Trustees Reports show that programs for the elderly are on an unsustainable course. The expenditures exceed the revenues to be collected, and the funding gap is projected to grow through time.
One way to assess the problem is to calculate the present value of the difference between expenses and revenues. This year, for the first time, the Trustees reported such calculations for all the elderly entitlement programs and the numbers are startling:
- Over the next 75 years, scheduled benefits exceed dedicated revenues by $33 trillion, measured in current dollars.
- Looking indefinitely into the future, the present value of the additional revenues required by Social Security and Medicare total almost $74 trillion.
To put that number in perspective, obligations to the elderly are more than six times the size of the economy and 18 times the size of the outstanding federal debt.
For many years, the Trustees Reports adopted a 75 year time horizon. But it is now understood that looking only 75 years into the future gives a misleading picture. Consider a worker who will retire in year 76. A 75 year horizon counts all of the taxes this worker will pay over the course of a lifetime, but ignores the benefits. To avoid this problem, the Trustees Reports are now including calculations that look indefinitely into the future.
What does it mean to have a $74 trillion revenue shortfall? It means that in order to pay benefits to current and future generations without using general revenues or cutting benefits, we need $74 trillion on hand right now, invested at the government's borrowing rate. Because we don't have $74 trillion invested today, next year the liability will be even larger. The year after that it will be larger still.
What is the composition of this implied debt? It may surprise many to learn that:
- Although policy makers have focused on the long-run sustainability of Social Security, the financial problem in Medicare is five times as great ($62 trillion versus $12 trillion).
- And while lawmakers have not reformed Social Security (which requires $12 trillion), they have more than doubled the size of that problem by creating a prescription drug benefit (which will require additional revenues of almost $17 trillion).
Some have asserted that an immediate solution to the problem is not needed, because the Trust Funds are flush with surpluses that can pay benefits well into the future. Yet these Trust Funds are not assets that can be used to pay benefits like the assets in a conventional pension fund. They are more like IOUs the government has written to itself. Every asset of the Trust Funds is a liability of the Treasury. Summing over both parts of government, the assets and liabilities net out to zero. In order to pay benefits in future years, the government will have to tax, borrow or cut spending on other programs.
To see the impact these programs will have on the government's finances and how quickly it will arise, we have calculated the percent of federal income taxes that will be needed to pay the deficits in Social Security and Medicare:
- This year, for the first time in many years, the federal government will have to draw on general revenues to cover the excess of spending over revenues in the combined elderly entitlement programs.
- Specifically, the funding deficit this year is equal to about 3.6 percent of federal income taxes.
- In less than five years, the share of income taxes needed will double, and five years beyond that it will double again.
- By 2019 (when the Medicare Trust Fund technically will be exhausted) the federal government will need more than one-in-four federal income tax dollars to pay benefits to the elderly, in addition to dedicated revenues.
With the retirement of the baby boomers, the financial problems begin to soar. But even after the baby boomers have exited the programs, the financial burden will continue to climb:
- By 2030 (about the mid-point of the baby boomer retirement years) we will need more than half of all federal income tax revenues to pay for the deficits of Social Security and Medicare.
- By 2040, we will need two-thirds of federal income taxes; by 2050, three-fourths.
- And, by 2070, the elderly will need all federal income taxes (in addition to all payroll taxes and premium payments), leaving nothing to pay for any other federal programs.
What can be done to avert this calamity? We have made reform proposals elsewhere. Clearly, we cannot sustain a pay-as-you-go system, under which promises made to today's workers must be paid by generations not yet born. Instead, we must move quickly to a funded system, under which each generation pays its own way.
[page]The 2004 Medicare and Social Security Trustees Reports were released on March 23.1 The cost estimates for Medicare's new prescription drug benefit and the worsening financial position of Medicare generated much public interest. Other estimates of the new benefit's 10-year cost proved to be $150 billion higher than the Congressional Budget Office's initial calculations. However, the real problem is not the near term; rather, it is the benefit's long-run expense. The 2004 reports measure this cost, along with Medicare's other long-range unfunded liabilities, for the first time. When combined with the long-run measures for Social Security, which were first reported last year, they reveal a sizable burden for future taxpayers.
"Social Security and Medicare require $33 trillion in additional funds to meet deficits over the next 75 years."
The numbers are incredible in magnitude, regardless of the time period or group of individuals considered. The present value of Medicare and Social Security additional funding requirements over the next 75 years totals more than $33 trillion. Calculated indefinitely into the future, these funding requirements total almost $74 trillion. A number this large is hard to fathom, considering that $74 trillion is currently over six times the size of our economy and almost 18 times the size of the national debt.
There is a widely held belief that this funding issue is tomorrow's problem. While the burdens mount considerably in the future, more than half of Social Security's and Medicare's unfunded obligations are actually owed to people who are alive today. Therefore, it behooves all of us to address the issues today rather than tomorrow.
In this paper we focus on the highlights of the two Trustees reports. The summary that accompanies their release provides an excellent outline of the main points in the two reports.2 Specifically, we will concentrate on the programs' implicit debts, the growth of the cash flow deficits, and their implied effect on the rest of the federal budget.
[page]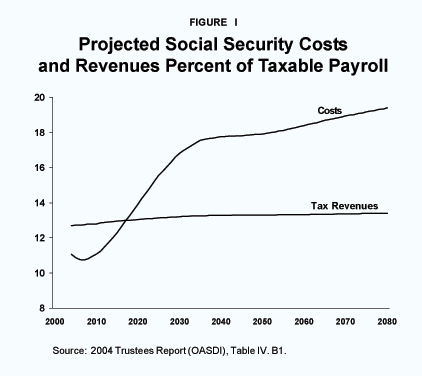
"They will require almost $74 trillion for all future years."
Social Security is in many ways easier to evaluate than Medicare. Because the dollar value of benefits are based on worker earnings histories, Social Security's costs can be estimated once earnings and tax revenues are forecast. In contrast, Medicare benefits are tied to health care consumption rates, rather than past earnings. Technological advances, institutional changes and tastes for health care play an important role in (and introduce greater uncertainties into estimating) the program's total cost. Also, Social Security, Old Age and Survivors Insurance and Disability Insurance are funded by payroll taxes and taxes on benefits. Medicare, however, is funded by a more complicated combination of payroll taxes, taxes on Social Security benefits, premium payments and general revenue transfers.
Social Security's funding requirements are commonly summarized by plotting its annual revenues and costs as a percentage of its tax base. As Figure I shows, the system's revenues are relatively stable, growing from 12.71 percent of payroll this year to 13.39 percent in 2080, with the modest rise attributable to increased revenues from the taxation of Social Security benefits.3 Costs will start growing rapidly when the first of the baby boomers become eligible for early retirement in 2008, and will continue until 2031 when the last of the baby-boomers reach the normal retirement age. While the program's current tax revenues exceed costs until 2018, in every subsequent year, the program faces a deficit that continues to grow forever.
Traditionally, media reports have summarized Social Security's financial health by the year in which the Trust Fund will be exhausted. This year, the exhaustion date is projected to be 2042. However, as Figure I indicates, the program will require transfers from the rest of the federal budget beginning in 2018. These transfers will be made until 2042 in exchange for previous transfers Social Security has made to the rest of the budget. Since 1983, Social Security's surplus funds have been credited to the Trust Fund, as a sort of intergovernmental loan, along with (notional) interest payments on the Trust Fund bonds. These transfers will continue until 2018, when surplus funds run out, and transfers back to Social Security begin. These past surpluses were not used to buy financial assets in the marketplace, however. Instead, they have either been spent on other government programs or used to reduce the federal debt held by the public. As a result, the Trust Funds are actually an accounting record of past transactions rather than a financial reserve the federal government can use to pay benefits.4 The 2004 annual reports' summary states, "Since neither the interest paid on the Treasury bonds held in the HI and OASDI Trust Funds, nor their redemption, provides any net new income to the Treasury, the full amount of any required Treasury payments to these trust funds must be financed by increased taxation, increased Federal borrowing and debt, and/or a reduction in other government expenditures."5
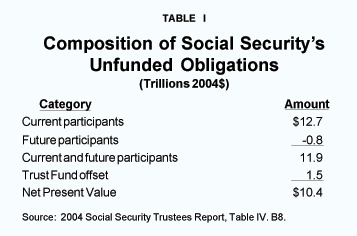
Table I summarizes the difference between Social Security's annual revenue and expense for the indefinite future in 2004 dollars.6 Historically, a 75-year horizon has been used to assess the program's financial position. However, that type of calculation understates the true magnitude of the problem. For example, it includes all the taxes paid by people who will retire in year 76, but ignores the benefits these taxpayers will expect to receive in return. Deficits beyond the 75th year are large and growing, and ignoring them understates the financial burden Social Security will impose on coming generations. For that reason, Table I shows the present value of the program's total costs less tax revenues calculated for an infinite horizon.
The first row in Table I shows that current participants will receive $12.7 trillion more in benefits than they will pay in taxes in all future years. That this current generation of participants will receive more in benefits than they will pay in taxes is not surprising, and in and of itself is no cause for alarm. Current participants are defined as workers and retirees 15 years of age and above in 2004. This generation is made up of those already retired, who are collecting benefits and contributing little if any revenue; those who are soon to retire and will begin collecting benefits while only paying taxes for a short time; and all other workers – down to those just entering the system, who will pay a lifetime of taxes before collecting any benefits.
Beginning in 2005, the next generation of participants will begin work. The members of this new generation will pay taxes over their entire work lives before collecting benefits.7 Yet as the second row of Table I shows, future generations will pay only $800 billion more in taxes than they receive in benefits instead of the $12.7 trillion required for solvency.8 Thus, the system as it stands now is $11.9 trillion short.
"The $1.5 trillion Social Security Trust Fund balance does not provide new revenues to the Treasury."
Table I next reports that the Social Security Trust Fund has a value of $1.5 trillion. As noted above, this Trust Fund does not provide new revenues to the Treasury. Instead, it represents the government's commitment to raise taxes or borrow or divert funds from other programs. From Social Security's perspective, the program is underfunded by $11.9 trillion less the $1.5 trillion in the Trust Fund, which produces the conventional measure of the unfunded obligation of $10.4 trillion. However, when viewed from the perspective of the Treasury, which must provide the funds to cover future shortfalls, the unfunded obligation is the full $11.9 trillion.9
Because we can forecast the amount and timing of revenue and expense flows over the next 53 years, government can implement policy changes that will provide the missing funding. To make the system solvent for coming generations, we need revenue increases or spending reductions or both. For example, a permanent 4.0 percentage point increase in the payroll tax rate today would produce a solvent system (excluding the Trust Fund from the calculation) – but only if government invests the proceeds of the new tax in assets that earn a real rate of return of at least 3.0 percent.
However, the government's ability to save surplus revenues is limited. It is not reasonable to expect the government to hold and direct financial or real assets of the magnitude necessary to bring about system solvency. The government would have to raise today's payroll tax to 16.4 percent and begin to buy real assets, like shares in General Motors, IBM, Microsoft and Exxon. Eventually, this new pension fund would hold assets in an amount equal to the entire output of the United States' economy. Such an accumulation held by the government is unprecedented in our country's history. Moreover, these funds could not be credited to the Trust Fund, then diverted to other federal programs or used as substitutes for other taxes, as they are now.
[page]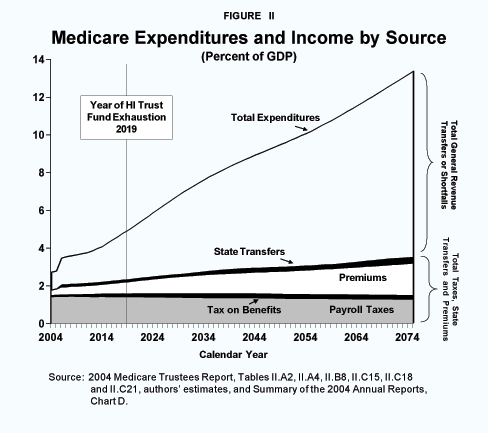
As noted above, Medicare is funded by a combination of payroll taxes, taxes on Social Security benefits, general revenue transfers, premium payments, and now – with the passage of the prescription drug bill – transfers from state governments. Medicare's differing components, coupled with the unpredictable nature of future medical expenditures, make its financial burden on the rest of the budget subject to more uncertainty.
"Medicare spending as a share of gross domestic product will grow from under 3 percent of GDP to more than 13 percent by 2075."
With the passage of the prescription drug benefit (the Medicare Modernization Act), Medicare now has three parts. First, Hospitalization Insurance (called HI, or Medicare Part A) helps pay the costs associated with hospital stays and the costs of home health, hospice, and skilled nursing facility care. Medicare Part A is financed by a dedicated 2.9 percent payroll tax and some revenues from taxing Social Security benefits. Second, Supplementary Medical Insurance now includes both Parts B and D. Part B helps pay the cost of physician visits, outpatient bills and home health bills, and is financed by beneficiaries' premium payments and general revenues. These premiums cover about 25 percent of the program's costs, with the remainder paid by general revenues. Third, the new prescription drug benefit (Medicare Part D) is also financed by premium payments and general revenue transfers, along with state transfers that are reimbursed from the Medicaid program for those Medicare beneficiaries who are also eligible for Medicaid. The combination of premiums and state transfers are expected to cover about 25 percent of the total cost of the prescription drug benefit, with general revenues covering the remainder.
Figure II shows the relative composition of Medicare's total funding sources along with its total costs as a percentage of Gross Domestic Product (GDP).10 In 2004, Medicare spending is expected to be 2.69 percent of GDP; by 2022 its share will double; and by 2038 its share will triple. By 2075 the program will be almost five times its current share of GDP. However, as the figure makes clear, the program's funding will not rise commensurately. In 2004 dedicated funding sources equal 1.74 percent of GDP, rising to 3.47 percent by 2075, due in large part to premiums that will grow along with total Medicare spending on Parts B and D. In 2004 these dedicated funding sources will account for 65 percent of total Medicare spending, but by 2019 when the Part A Trust Fund is exhausted, they will account for less than half of the funding requirements. By 2042 – which is the same year the Social Security Trust Fund is exhausted – dedicated resources for Medicare account for less than one-third of the system's projected expenses, and by 2075 they shrink to only 26 percent of expenditures.11
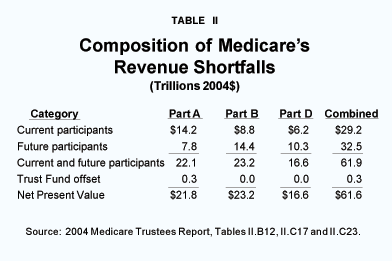
Table II summarizes the differences between expenditures and revenues for each part of Medicare for the indefinite future, in 2004 dollars.12 For Medicare Part A, the present value of this difference is $14.2 trillion for current participants and another $7.8 trillion for future participants – a total of $22.1 trillion. This means that the current value of the additional resources necessary to fund Part A alone is almost double the amount required to fund Social Security.13
The additional funding required by Medicare, Part B, comes to $8.8 trillion for current participants and $14.4 trillion for future participants – producing a $23.2 trillion total. The Trustees Report does not label this as an "unfunded" obligation, however, because it is assumed that general revenues, no matter how large, will be automatically appropriated and transferred to Part B, as current law requires. The amounts reported as revenue shortfalls in our Table II for Parts B and D are reported in the Trustees Reports, Tables II.C17 and II.C23, as "general revenue contributions." Regardless of the labeling, these amounts reflect the transfers from the rest of the budget necessary to pay the difference between projected benefits and premium payments.14
The passage of the Medicare Modernization Act added a significant general revenue obligation to the federal budget, identified in the Part D column of Table II. Current Medicare participants are expected to receive $6.2 trillion in benefits over and above expected premium payments and state transfers. Future Medicare participants add $10.3 trillion in spending that must be made up from federal general revenues, for a total of $16.6 trillion. Therefore, the prescription drug benefit adds a general revenue commitment to the federal budget that is almost 40 percent higher than the additional funding requirements needed to make the Social Security program solvent. The combined obligations of the Medicare program are staggering. For current beneficiaries, the present value of Medicare spending over and above all dedicated funding sources is $29.2 trillion. For future participants, another $32.5 trillion is required, resulting in a total burden of $61.9 trillion above expected revenues. Note that the new prescription drug benefit also increased Medicare's additional funding requirements by 37 percent, from $45 trillion to the $61.9 trillion.
[page]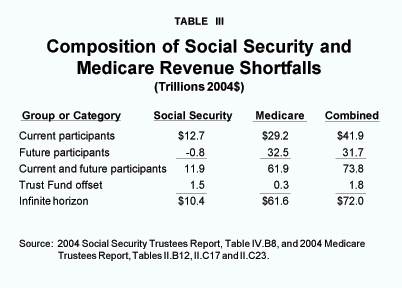
"We need $74 trillion on hand and invested today to avoid benefit cuts or tax increases."
In order to fully understand the burden that currently legislated elderly entitlement programs will place on future taxpayers, we must look at Social Security and Medicare finances in combination. As Table III shows, funding the current generation's benefits will require additional transfers with a present value of $41.9 trillion. The present value of additional funding requirements for future generations is another $31.7 trillion. Together, current and future generations will require additional funding of $73.8 trillion. Even if we treat the Trust Funds as real funding sources rather than simply commitments to provide funding, the programs are still short $72 trillion.
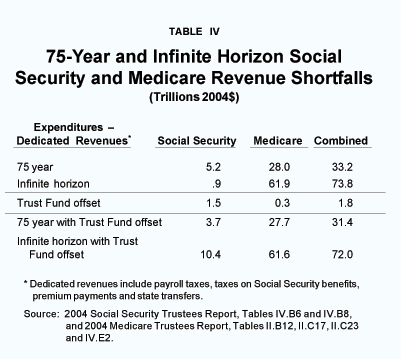
Table IV decomposes the funding requirements by time period. The present value of the Social Security's additional funding needs over the next 75 years is $5.2 trillion and Medicare's is $28 trillion, for a $33.2 trillion total.
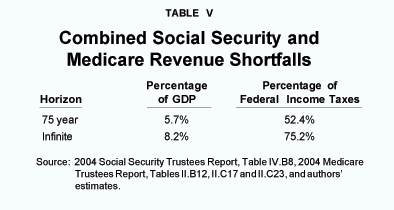
In Table V we present the total dollar amounts relative to the present values of GDP and federal income taxes for both the 75-year and the infinite horizon:
- Over the next 75 years, an additional 5.7 percent of GDP will be needed to pay scheduled benefits – an amount equal to 52.4 percent of projected federal income tax receipts.
- For long run solvency, an additional 8.2 percent of GDP will be needed – or 75.2 percent of projected federal income tax receipts.
"The additional revenue required equals more than three-fourths of future income tax revenues."
If projected Social Security and Medicare shortfalls are to be funded, Congress must pass legislation, binding on all future Congresses, that sets aside 75.2 percent of federal income tax receipts in every year from now to eternity! Importantly, the funds set aside cannot be spent on other programs, as is currently done with such surpluses. Instead the funds must be set aside and invested in real assets. Put another way, in order to solve the funding problems we have discussed in this paper, current federal expenditures must be reduced immediately and permanently by more than 50 percent.
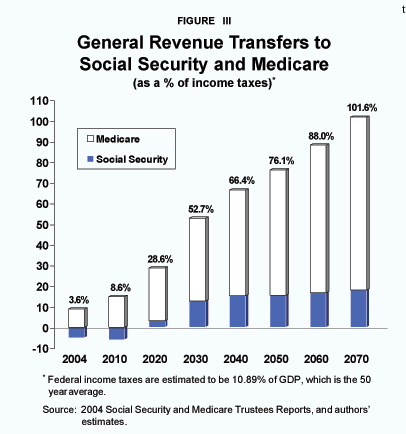
In Figure III we present the general revenue transfers to Social Security and Medicare as a percentage of federal income tax receipts (corporate and individual income taxes). We use federal income tax receipts to denominate the transfers because these taxes are the primary source of revenue from which the transfers must be drawn.15
In 2004, Social Security's surplus is expected to equal 5.1 percent of federal income tax receipts while Medicare's combined deficit is expected to equal 8.7 percent of federal income tax receipts. To fully fund legislated benefits, Social Security and Medicare combined will require a transfer equal to 3.6 percent of federal income tax receipts, plus legislated payroll taxes, taxes on Social Security benefits and premiums. By 2010, the draw on federal income tax receipts will increase to 8.6 percent; by 2030 it will exceed 50 percent; by 2050 it will exceed 75 percent; and by 2070 the transfer necessary to fund projected benefits will consume more than all projected federal income tax receipts. Without higher tax rates, all other government programs funded by these taxes will have to be eliminated over the next 67 years!
How high will taxes have to rise, if other federal programs are not cut? By 2010 federal income taxes' share of GDP will have to rise 5 percent to cover Social Security and Medicare transfers and to maintain current funding levels for other programs. By 2020, taxes will have to rise 25 percent; and by 2030 federal income taxes will have to rise almost 50 percent. By 2050 they will have to be 73 percent higher than their current level.
[page]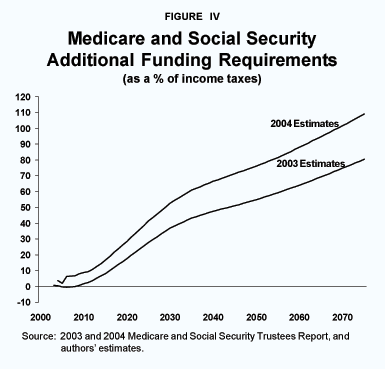
"Medicare's unfunded obligations rose by 30 percent in one year."
What has changed from 2003 to 2004? In terms of the cost of future elderly entitlements, it is the passage of the Medicare Modernization Act. This new legislation represents the largest expansion of elderly entitlements since the passage of Medicare almost 40 years ago. As noted above, the new program's value expressed in 2004 dollars is $16.6 trillion. This represents a 30 percent increase in the funding required by the federal government to pay elderly entitlement benefits. The legislation also increased Medicare Part A unfunded obligations by increasing payments to private and rural health care providers, resulting in an even larger entitlement debt. Figure IV shows annual additional funding requirements as projected last year compared to the projection for 2004. As the figure shows, an additional 11 percent of income taxes will be required in 2020, and by 2030 an additional 16 percent will be necessary. By the end of the horizon the new legislation will require an additional 30 percent of federal income tax receipts. These dramatic increases in future costs show that adding new benefits without full consideration of their long run costs is a perilous course of action.
[page]"Postponing solutions will only make the problems worse."
Based on dedicated revenues, both Social Security and Medicare are severely underfunded. Paying scheduled benefits will require significant additional funding. When we consider both annual revenue "flows" necessary to pay benefits and "stocks" represented by the programs' implied debts, we can characterize the true size of this problem. Projected annual shortfalls indicate that by 2050, if the government is to pay scheduled benefits to the elderly entitled, it will have to devote 75 percent of federal income tax revenues over and above the programs' dedicated revenues. The stock measure shows that, over the next 75 years, the combined additional funding requirements total more than $33 trillion, and the present value of their funding requirements over the indefinite horizon comes to almost $74 trillion.
Although the calculation of these revenue shortfalls span many years into the future, the search for solutions should not be postponed. Each year of delay reduces our ability to respond effectively. It is to our advantage to consider saving more now, rather than seeing our benefits diminish during our retirement years, when we have reduced earnings capacity.
NOTE: Nothing written here should be construed as necessarily reflecting the views of the National Center for Policy Analysis or as an attempt to aid or hinder the passage of any bill before Congress.
[page]- The 2004 Annual Report of the Board of Trustees of the Federal Old-Age and Survivors Insurance and Disability Insurance Trust Funds and The 2004 Annual Report of the Board of Trustees of the Federal Hospital Insurance and Federal Supplementary Medical Insurance Trust Funds.
- See Status of the Social Security and Medicare Programs: A Summary of the 2004 Annual Reports, Social Security and Medicare Board of Trustees.
- The Figure is based on Table IV.B1 in The 2004 Annual Report of the Board of Trustees of the Federal Old-Age and Survivors Insurance and Disability Insurance Trust Funds.
- Some argue that Trust Fund balances represent savings, because the national debt held by the public would be higher by the amount of the Trust Fund had the surpluses not existed. However, whether or not the Trust Funds are actually savings, they do not provide resources to the federal government.
- Status of the Social Security and Medicare Programs: A Summary of the 2004 Annual Reports, Social Security and Medicare Board of Trustees, page 9.
- From The 2004 Annual Report of the Board of Trustees of the Federal Old-Age and Survivors Insurance and Disability Insurance Trust Funds, Table IV.B8.
- In fact, in a properly designed system, the new generation would make a net contribution to the system that is equal to the net cost of the current generation.
- In addition, the present value calculation underlying the numbers in Table I is done as if future generations (those 14 and younger today and those yet to be born), set aside their tax payments in a fund that grows at a real interest rate of approximately 3 percent between 2004 and their retirement. Thus, the first group of retirees reaches the normal retirement age in 2057, with only disability and survivor's benefits being drawn from the fund during the intervening years. With this understanding, it is clear that the system is not solvent for the new entrants, given that the taxes they pay during their working years will be used to pay benefits of retirees during those years.
- Even this measure is optimistic because it assumes that all surpluses between now and 2018 are actually invested in assets that yield a real rate of return of 3 percent per annum. If the surpluses are spent on other government programs, the unfunded obligation rises to $12.7 trillion.
- From The 2004 Annual Report of the Board of Trustees of the Federal Hospital Insurance and Federal Supplementary Medical Insurance Trust Funds, Tables II.A2, II.A4, II.B8, II.C15, II.C18, and II.C21.
- If we continued to dedicate the current general revenue transfer of 0.95 percent of GDP to Medicare in all future years, the combined funding would cover 57, 41, and 33 percent of the program's costs in 2025, 2050, and 2075, respectively. This indicates that in future years Medicare will require significant funding in addition to what is currently committed.
- From The 2004 Annual Report of the Board of Trustees of the Federal Hospital Insurance and Federal Supplementary Medical Insurance Trust Funds, Tables II.B12, II.C17, and II.C23.
- Even treating the small-Part A Trust fund as an offset, only reduces the obligation to $21.8 trillion.
- One of the appendices to the Medicare Trustees Report discusses the relationship between the Social Security and Medicare programs and the federal budget. In that appendix, the 75 year group obligations are presented from both the budget and trust fund perspectives. The tables here present the funding requirements from a total budget perspective. One may argue that because SMI Part B is already receiving a transfer from general revenues and the $23.2 trillion shortfall includes these transfers, then the added burden is less than $23.2. In 2004, the general revenue transfer to Part B was equal to 0.95 percent of GDP. If the 2004 transfer of approximately 0.95 percent of GDP is considered as a permanent commitment for future funding amounting to 0.95 percent of GDP in all future years, the Medicare Part B burden is reduced to $14.5 trillion.
- Over the last 50 years the federal income tax receipt share of GDP has been remarkably stable with fluctuations primarily related to the state of the economy rather than tax code changes. Income tax receipts have averaged 10.89 percent of GDP with a high of 13.4 percent in 1954 to a low of 8.5 percent in 2003. Our calculations assume income tax receipts will continue to average 10.89 percent of GDP in the future. The values in the figure can be interpreted as the share of future federal revenues that will be required to fund Social Security and Medicare in addition to their dedicated funding sources.
Dr. Andrew J. Rettenmaier is the Executive Associate Director at the Private Enterprise Research Center at Texas A&M University. His primary research areas are labor economics and public policy economics with an emphasis on Medicare and Social Security. Dr. Rettenmaier and the Center’s Director, Thomas R. Saving, have presented their Medicare reform proposal to U.S. Senate Subcommittees and to the National Bipartisan Commission on the Future of Medicare. Their proposal has also been featured in the Wall Street Journal, New England Journal of Medicine, Houston Chronicle and Dallas Morning News. Dr. Rettenmaier is the co-principal investigator on several research grants and also serves as the editor of the Center’s two newsletters, PERCspectives on Policy and PERCspectives. He is coauthor of a book on Medicare, The Economics of Medicare Reform (Kalamazoo, Mich.: W.E. Upjohn Institute for Employment Research, 2000) and an editor of Medicare Reform: Issues and Answers (University of Chicago Press, 1999). Dr. Rettenmaier is a senior fellow with the National Center for Policy Analysis.
Dr. Thomas R. Saving is the Director of the Private Enterprise Research Center at Texas A&M University. A University Distinguished Professor of Economics at Texas A&M, he also holds the Jeff Montgomery Professorship in Economics. Dr. Saving is a trustee of the Social Security and Medicare Trust Funds. His research has covered the areas of antitrust and monetary economics, health economics, the theory of the banking firm and the general theory of the firm and markets. He has served as a referee, or as a member of the editorial board, of several major U.S. economics journals and is currently an editor of Economic Inquiry. Dr. Saving has authored many articles and two influential books on monetary theory. He has been president of both the Western Economics Association and the Southern Economics Association. After receiving his Ph.D. in economics in 1960 from the University of Chicago, Dr. Saving served on the faculties of the University of Washington and Michigan State University, moving to Texas A&M in 1968. Dr. Saving served as chairman of the Department of Economics at Texas A&M from 1985-1991. Dr. Saving is a senior fellow with the National Center for Policy Analysis.