Social Security’s Trustees predict the program will begin paying out more than it collects by 2017, and by 2041 will have exhausted its legal authority to draw on other parts of the federal budget to pay full benefits.
In response, the Bush Administration has proposed a two-part Social Security reform plan that would reduce the growth in initial benefit payments awarded to higher earners and allow all younger workers to invest part of their Social Security payroll tax dollars in personal retirement accounts.
President Bush has embraced a progressive price indexation plan of the type developed by investment banker Robert Pozen. However, Pozen’s price indexation formula was designed with personal retirement accounts equal to 2 percent of wages in mind. The Bush administration is pursuing personal accounts twice that size. If the goal is to approximate benefits promised under the current system, a progressive price indexation formula different from Pozen’s is needed.
NCPA Research Fellows at the Private Enterprise Research Center at Texas A&M University have developed a formula that better fits the administration’s 4 percent account. The reformed Social Security benefits have these features:
- The progressive price-indexed benefit for very low income workers would remain at 100 percent of benefits promised under current law.
- By contrast, the progressive price indexed benefit will equal only 56 percent of benefits promised under current law for the highest earners by the time today’s five year olds reach the retirement age.
- Personal retirement account annuities will provide an increasing percentage of total retirement benefits over time for higher earners, primarily because their scheduled benefits are a smaller percentage of lifetime earnings.
- The combination of private annuities and government-paid benefits will provide a retirement income for high income workers approximately equal to their currently promised benefits — and a retirement income for low earners that is greater than currently promised benefits — while at the same time making Social Security solvent for the long run.
- Under current law, the Old Age and Survivors portion of Social Security faces a 75-year unfunded obligation (costs minus income) of $4.8 trillion. The Pozen benefit formula (plus Bush-style 4 percent accounts) would produce a 75-year unfunded obligation of $5.5 trillion; however, the cash flow turns from negative to positive in 2061.
- The alternative plan presented in this paper faces a 75-year unfunded obligation of $4.6 trillion and the cash flows turn from negative to positive by 2055.
One fifth of America’s senior citizens depend on Social Security as their sole income and two-thirds of our elderly count their benefits as half or more of their retirement income — which is why discussions of changing the program are often met with much resistance and concern. However, as currently structured, the program cannot endure and must change.
By 2017, the system’s revenues will fall short of its costs. In that year and every year thereafter, general federal revenues must be tapped to pay benefits. Some assure us we need not worry until 2041, given that the Social Security Trust Fund’s actuarial balances will be positive until that date. However, the payment of benefits through redemption of Trust Fund bonds will require mounting transfers from the rest of the budget and thus implies higher taxes, reduced spending on other programs or increased government borrowing.
Ultimately anyone who seriously hopes to address Social Security’s finances must offer a plan that balances the system’s cost and revenues in the long run. Such a balancing precludes a repeat of the 1983 reforms — which were expected to solve the problem for only 75 years. Those reforms relied on the notion that a Trust Fund could provide resources for the future, that the government could and would save for the future, and that after the 75-year horizon, the system would be reformed so that the large deficits forecast for the end of the horizon could be met.
If the post-1983 surpluses had been invested in financial instruments purchased in the marketplace, the Trust Fund would represent real savings. But given our collective aversion to the government being a significant stakeholder in U.S. corporations, it is not feasible for the Trust Fund to be invested in the private sector. As a result, the surpluses credited to the Social Security Trust Fund have been spent rather than saved. The Trust Fund’s holdings consist of special government bonds which one government agency (the Treasury) has issued to another (the Trust Fund), and do not represent real savings. And as several recent studies have concluded, the Trust Fund did not add to national savings and may have encouraged spending more than the surplus amounts. 1
This leaves us with two alternative paths to reform, both of which recognize the government’s inability to save and both of which balance the system’s costs and revenues in the long run. The similarities end there.
Option One: Continue Pay-As-You-Go. The first path balances costs and revenues by reducing benefits and raising taxes so that benefit payments in each year are close to the tax revenues in each year. Peter Diamond and Peter Orszag have developed such a proposal that imposes tax increases and benefit cuts on the same higher income workers.2
Option Two: Prefund Future Benefits. The second path relies on prepaying some or all of Social Security’s future benefits through personal retirement accounts (PRAs). President Bush’s approach falls into this category. The president would 1) reduce the growth in initial benefit payments by changing the benefit indexing formula from full wage growth indexation to progressive price indexation, and 2) prefund a portion of future benefits by establishing PRAs for young workers. In many ways, the President’s proposal represents a compromise between those who favor the current arrangement and those who favor personal accounts. The proposal can ultimately produce a solvent system that gives workers ownership of some of their Social Security benefit.
In a previous policy report, we offered a fully prepaid Social Security reform proposal that replicated, on average, the current benefit formula for lower and higher income workers.3 As we demonstrated, replicating the current redistributive benefit structure requires either higher contribution rates to PRAs for lower income workers or progressive contributions.
In this paper we offer a variant of progressive price indexation combined with PRAs similar in size to those suggested by President Bush. In contrast to our previous proposal, which identified the additional contributions that would be necessary to fully prepay benefits, this analysis examines a partially prepaid system combined with a reformed defined benefit. Also in contrast to our previous proposal, this analysis, following the president’s proposal, relies on additional borrowing rather than higher taxes to finance contributions to the PRAs.
[page]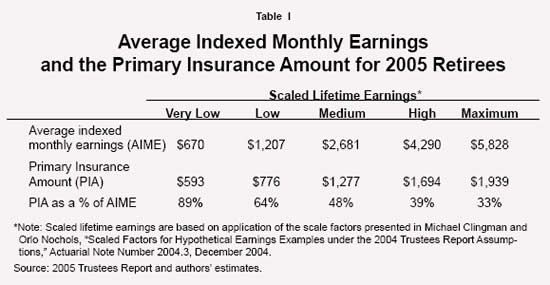
To understand how progressive price indexing works we must first understand how Social Security benefits are calculated. Currently, the Social Security Administration examines a worker’s earnings history — an individual record of past annual earnings for all years in which Social Security taxes were paid — and identifies the 35 highest-earning years after the earnings have been adjusted by a wage index. Past earnings are indexed upward by the growth in wages each year. These indexed past earnings are then averaged to produce a worker’s average indexed monthly earnings (AIME). [See the appendix for more details.]
A formula is then used to covert the AIME into a recipient’s monthly benefit, referred to as the primary insurance amount (PIA). PIAs for low income workers represent a higher percentage of their AIMEs than do the PIAs for higher income workers. The replacement rate — Social Security benefits as a percent of preretirement indexed earnings — is determined by the relationship between a worker’s AIME and the PIA formula, which produces progressively lower replacement rates as the AIME rises.
- Under current law, for example, lower-wage workers retiring this year can expect Social Security to replace 58.3 percent of their preretirement earnings.
- The replacement rate for middle- and higher-income workers is 43.6 percent and 36.1 percent, respectively.
- Because of the redistributive nature of the current system, workers who earn the maximum taxable wages can expect a replacement rate of only 30.1 percent.
The formula has two “bend points” that rise with the increase in average wages. The bend points are established in the year a worker becomes eligible for early retirement benefits (currently at age 62). Thus, workers reaching normal retirement age this year will retire with bend points established in 2002.
- For AIMEs below the first bend point — $592 in 2002 — each additional dollar of average wages increases the monthly benefit by 90 cents.
- Between the first and second bend points — from $592 to $3,567 in 2002 — an additional dollar of average wages increases monthly benefits by 32 cents.
- Finally, each additional dollar of average wages above $3,567 increases monthly benefits by 15 cents.
Table I gives a few examples of the relationship between AIME and PIA amounts for retirees in 2005 who had very low, low, medium and high lifetime earning as well as for those who earned the taxable maximum in each year. As illustrated in Figure I and presented in Table I, retirees with higher earnings have lower replacement rates than do lower income retirees. Recognizing the redistributive nature of the current formula is helpful in understanding the effects of progressive price indexation for different income classes and how PRAs can fill the gap in benefits.
[page]Progressive price indexing refers to a change in the benefit formula that progressively applies less wage indexing to benefits as income rises. It would reduce the benefits paid by Social Security to higher lifetime earners while leaving the benefits paid to lower income workers unchanged. The Social Security actuaries have evaluated a reform proposal designed by Robert Pozen, who was a member of the President’s Commission to Strengthen Social Security.4 In that proposal, progressive price indexation was combined with PRAs equal to 2 percent of a worker’s earnings up to $3,000.
Under Pozen’s progressive price indexing formula, workers in the lower 30 percent of the lifetime earnings distribution would receive 100 percent of the benefits scheduled under current law, but workers above this threshold would be subject to progressively less wage indexation. Essentially, the purchasing power of the benefits of workers who earn the taxable maximum would be fixed at the level that exists in 2012 — that is, they could be adjusted upward for inflation, but with no additional benefit from faster-rising wage growth.
Readers should note that Pozen developed his progressive price indexing formula with a personal account funded by 2 percent of wages. President Bush, by contrast, has called for accounts funded by 4 percent of wages, twice the size of Pozen’s. With 4 percent personal retirement accounts — which, because of their size, can fund a greater portion of retirement benefits — it is appropriate to devise a less generous progressive price indexing formula, similar to the one we propose below.
Because of the higher benefit levels funded out of the 4 percent accounts, our progressively price indexed Social Security system can be less expensive than either current law or the Pozen approach coupled with 4 percent accounts — and still provide benefits similar to what the current system promises.
[page]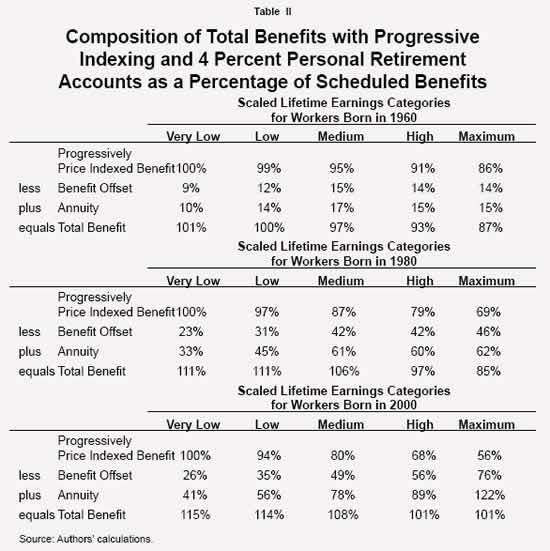
In what follows, we combine the progressively price indexed benefits described above with personal retirement accounts funded by 4 percent payroll contributions. 5
Under the proposal by the Bush Administration, workers who elect to open a PRA must agree to have their reformed taxpayer-provided Social Security benefit reduced by a certain amount — called the benefit offset — to reflect the tax money diverted from traditional Social Security into the personal accounts. This is done by calculating the accumulated value of the worker’s personal account contributions using a specified rate of return for each preretirement year. The government borrowing rate of return is used to calculate this accumulation, which is generally called a shadow, hypothetical or notional account. The benefit offset is equal to the computed amount of a life annuity purchased with this hypothetical accumulation.
Basically, if a worker’s account earns a rate higher than the offset rate, he will earn a higher total benefit (reformed promised benefit plus personal retirement account annuity minus the benefit offset) than if he did not have the account. By contrast, if the worker’s rate of return falls below the offset rate, the worker would have been better off without the personal account.6
A New Progressive Price Indexing Formula. We have devised an adjustment to the current benefit formula that produces a simple form of progressive price indexation, and estimated the effects of this reform combined with a PRA funded by 4 percent of wages. The reformed benefits plus the net annuity value from the retiree’s PRA will produce total benefits which are ultimately on average greater than or equal to scheduled benefits for all income groups.
With our adjustment, retirees whose average indexed monthly earnings are less than the first bend point in the benefit formula will receive benefits from traditional Social Security equal to 100 percent of the benefits they are currently scheduled to receive. At the other end of the earnings distribution, maximum earners receive benefits from Social Security indexed for prices rather than wages. The price indexation is accomplished by calculating benefits according to the current schedule and deflating these benefits by a real wage index. Workers born in 1950 and later participate in the reform, while those born in 1949 and earlier remain in the current program and receive currently scheduled benefits.7 With this adjustment, retirees who earn the taxable maximum receive no real wage indexation, while those whose earnings are closer to the first bend point receive benefits similar to those that they are currently scheduled to receive.
Total Benefits by Age and Income. Table II summarizes the effect of progressive price indexing and personal retirement accounts on total benefits for workers who are born in 1960, 1980 and 2000 (individuals who are 45, 25 and 5, respectively, in 2005). The table presents the composition of total retirement benefits as a percentage of currently scheduled benefits. There are a few things to note in the table:
- First, the progressive price-indexed benefit for very low income workers remains at 100 percent of scheduled benefits for all future birth years.
- Second, price indexation has the greatest effect on the maximum earners; by the time today’s 5 year olds, who earn the taxable maximum for their 35 highest years, reach retirement, price indexation will result in benefits equal to 56 percent of scheduled benefits.
- Third, the annuities of higher income workers provide an increasing percentage of their retirement benefits, due in large part to the fact that their scheduled benefits, as described earlier, are a smaller percentage of lifetime earnings.
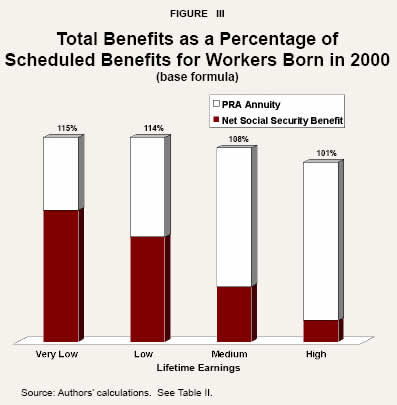
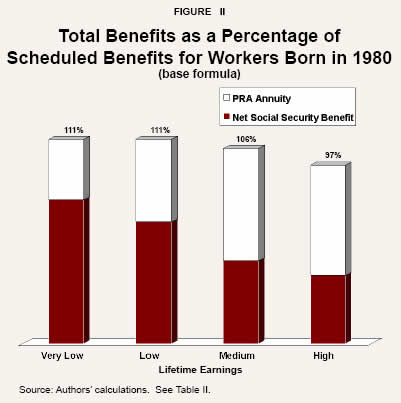
Figures II and III show how total retirement benefits stack up against scheduled benefits for workers born in 1980 (today’s 25 year olds) and for those born in 2000 (today’s 5 year olds). The lower portion of each bar identifies the reformed benefit with progressive price indexing less the benefit offset, which is the difference between the first and second rows in each panel in Table II. As designed, the higher one’s lifetime earnings, the greater is the effect of price indexing and the greater is the size of the benefit offset relative to scheduled earnings. Further, the longer the reform is in place the greater the effect of price indexing and the benefit offset and the larger the contribution the personal account makes to a retiree’s total retirement benefits. Altogether, the reformed benefit paid by Social Security plus the net personal account annuity produces total retirement benefits comparable on average to the Social Security benefits scheduled under current law.8
Reform vs. Status Quo. Figure IV compares the costs and revenues of the reformed program to the status quo. Because the proposal’s primary focus is retirement benefits, this graph is limited to the Old Age and Survivors portion of the Social Security program, and thus excludes the disability insurance program, which is assumed to remain unchanged. The familiar status quo income and cost rates indicate that the OASI portion of the program is in surplus until 2018 and then experiences deficits in every year thereafter. The graph also shows the effects of progressive indexation alone on the costs of the program. These costs rise throughout the retirement of the baby boom generation and peak as a percentage of taxable payroll in the mid-2030s and then gradually decline.
The final two lines in the graph show the ultimate costs after taking into account the benefit offset and the ultimate income after taking into account the contributions to PRAs. These lines show that beginning in 2009, the surplus and additional revenues will be needed to fund the personal accounts. The difference between the status quo and the reform income series is equal to the contributions to the personal accounts for workers who are younger than retirement age. The ultimate reform cost rate shows how the benefit offset further reduces the costs of the program. These costs peak as percentage of taxable payroll in 2030 and then decline rapidly. By 2055 the reform costs are less than the reform income. The surpluses in the following years can be used to pay down the debt that has accumulated or to supplement the personal accounts.
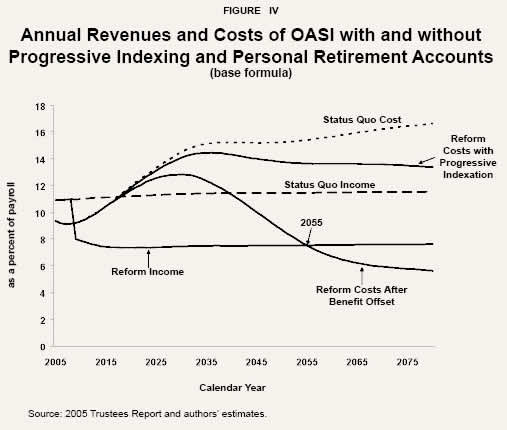
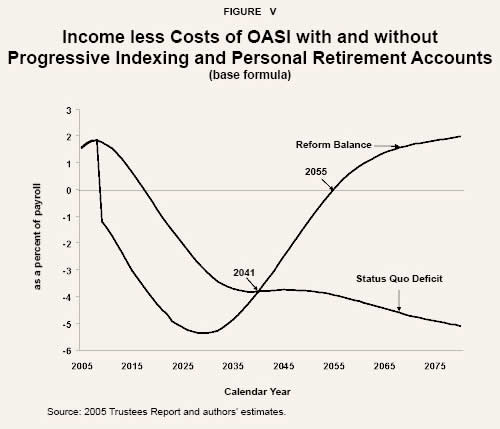
Figure V depicts the surpluses and deficits as a percentage of taxable payroll associated with continuing the current financing arrangement and with a reformed program. The lines in the graph show the net benefits or costs to the rest of the federal budget. Beginning in 2009 and continuing to 2040 the reformed program imposes higher net costs on the rest of the budget than continuing the current financing arrangement. In 2041 and later the reformed program is less of a burden on the government’s finances and, as previously mentioned, in 2055 begins to produce surpluses.
Filling the Gap. Figure V simply shows the net costs of the two financing arrangements as a percentage of taxable payroll and does not identify the funding source. Thus far, the president has ruled out tax increases as a funding source. If the deficits from 2009 to 2055 are funded through additional borrowing, then the federal debt would grow as a percentage of gross domestic product (GDP) throughout the projection period. Figure V also shows deficits in the current financing arrangement grow each year after 2017. If the initial surpluses under the current financing arrangement are used to reduce the debt and the subsequent deficits are funded through additional borrowing, the federal debt would also grow as a percentage of GDP. Toward the end of the projection period the debt under the current financing arrangement would exceed the debt under this formulation of the president’s proposal, with the accumulated debt approaching an amount equal to 100 percent of GDP in 2080.
The Importance of Explicit vs. Implicit Debt. Accounting for changes in the explicit debts of the federal government does not recognize how the two alternative paths affect the federal government’s total explicit and implicit debts. Clearly, the combination of progressive indexing and personal retirement accounts eliminates more of the long run unfunded obligations of the Social Security program, and thus eliminates more of the implicit debt. This is not to say that the way in which the deficits are financed is irrelevant. The choice of financing bears critically on which generations ultimately shoulder the burden of the program’s costs. If one of the goals of reform is to reduce the burden on future generations of workers, the current working generation will have to pay some of the costs. This can be accomplished through additional general revenue transfers financed by reductions in other government programs, through increased general tax revenues, through mandatory contributions to the personal accounts or through additional payroll tax revenues. Several proposals have called for increasing payroll tax revenues by increasing the taxable maximum. Should such a change be made, it is of paramount importance that the additional surpluses be directed into personal retirement accounts rather than diverted to other uses.
[page]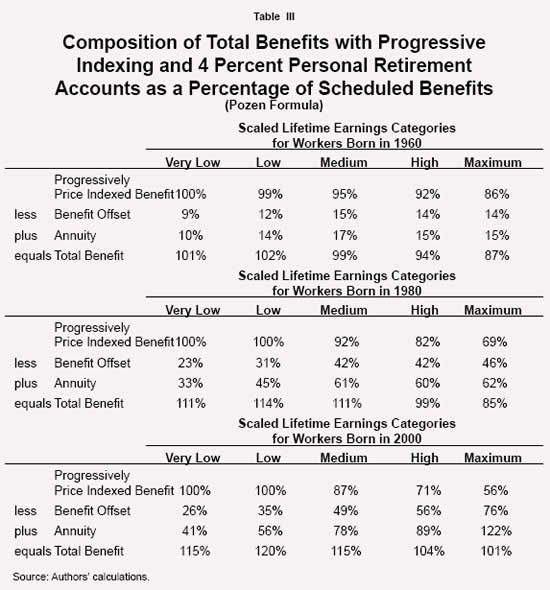
The original proposal advocated by Robert Pozen retains scheduled benefits for a larger segment of the retired population than the adjustment evaluated above. Rather than starting progressive indexing at the first bend point in the current benefit formula as above, Pozen has suggested that a new earnings level be defined each year at which progressive indexing begins to affect the calculation of benefits. Specifically, the new bend point would be the first bend point plus 28.6 percent of the difference between the second and first bend point.9 Because this new bend point is above the first bend point, a greater share of new retirees will receive their full scheduled Social Security benefits before the benefit offset. As with the adjustment described above, maximum earners receive benefits from Social Security that are indexed for prices rather than wages. Given that Social Security is paying 100 percent of scheduled benefits, before the benefit offset, to a larger share of retirees, the Pozen version of a progressively price indexed benefit formula, combined with 4 percent PRAs will be more expensive than the one just evaluated. Recall that the adjustment to the benefit formula suggested by Pozen was in conjunction with 2 percent PRAs rather than 4 percent accounts.
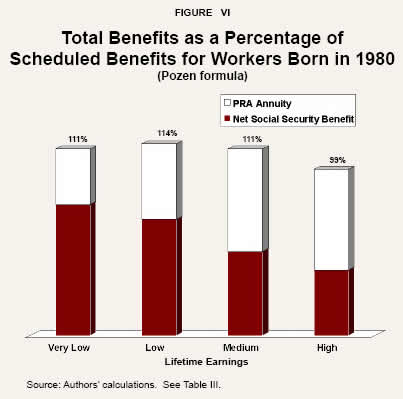
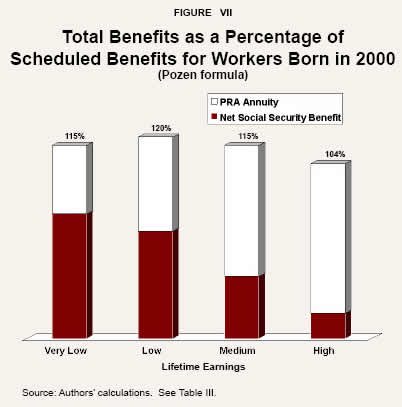
For illustrative purposes we now repeat the exercises performed above using the Pozen benefit formula and 4 percent accounts. Table III shows the composition of total benefits for workers born in 1960, 1980 and 2000. As expected from the similarities in the two benefit formulas, the composition of benefits for the very low earners and the maximum earners are identical in both exercises. In the Pozen formula, low earners’ progressive price indexed benefits equal 100 percent of their scheduled benefits. In the previous simulation, however, progressive price indexation resulted in reformed defined benefits slightly less than 100 percent of this group’s scheduled benefits. The reformed defined benefits and total benefits for the low, medium and high earning groups in each birth year exceed the benefits based on the previous simulation. Figures VI and VII parallel Figures II and III and provide a graphical representation of the net Social Security benefit, the PRA annuity and the total benefit for workers born in 1980 and 2000.
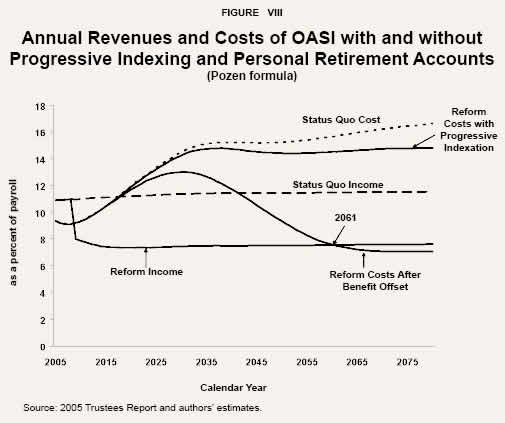
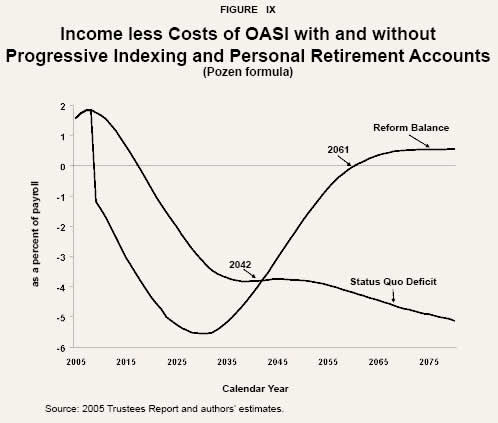
The trade-off for the more generous benefits can be seen in Figures VIII and IX. Comparing Figures II and VIII, the Pozen formulation of progressive indexation reduces the cost of the system by less than the base formula. When combined with the benefit offsets, the ultimate cost rate falls below the reformed income rate by 2061 rather than in 2055 based on the first simulation. Figure IX indicates that by 2042 the Pozen plan would result in lower net costs than continuing the status quo. This is one year later than in the first simulation. Further, the greatest deficit with the Pozen proposal is 5.6 percent of payroll, whereas the greatest deficit with the base formulation was 5.4 percent of payroll.
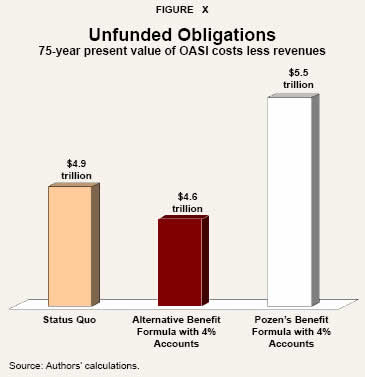
We now compare the alternatives by calculating the present value of the difference between the respective revenues and costs. Readers should note that an examination of the unfunded obligations over the next 75 years will be biased toward the status quo. Such an examination captures the next 13 years of surpluses under the status quo, but ignores the mounting deficits in the years beyond the 75th year. By contrast, the 75-year window will capture the larger deficits in the early years of the Social Security reform but ignore savings in years beyond the window. [See Figure X.]
- Under current law, Social Security faces a 75-year unfunded obligation (costs minus income) of $4.86 trillion.
- The Pozen benefit formula (plus Bush-style 4 percent accounts) leaves a 75-year unfunded obligation of $5.5 trillion; however, the cash flow turns from negative to positive in 2061.
- The alternative plan presented in this paper leaves a 75-year unfunded obligation of $4.6 trillion; however, the plan turns from negative to positive by 2055.
The Pozen benefit formula combined with 4 percent accounts produces higher benefits than the alternative plan. Pozen’s original plan called for 2 percent accounts. However, if 4 percent accounts are established, the more aggressive price indexing we have suggested is justified.
[page]We have evaluated two variants of a reform proposal that combines progressive price indexing with personal accounts — both of which are components of the general framework outlined by the president. The president’s proposal provides for partial prepayment of Social Security benefits and protection of retirees who had low lifetime earnings. The proposal is a compromise between those who favor the current financing arrangement and those who favor personal accounts. Importantly, a reform along the lines of that proposed by the president can make Social Security solvent in the long run while at the same time preserving the real benefits promised but not payable by the current system.
Fundamental reform with prepayment can revitalize Social Security while reducing government debt. Over the short term, reform is not free. Over the long term, reform reduces taxes and restores Social Security to a sound fiscal position and benefits recipients and workers alike. To the degree that reform increases savings, future national income will be higher. Any reform that includes an increase in the taxable maximum must at the minimum provide that the additional revenues be implicitly deposited in personal retirement accounts.
Importantly, even if Social Security is reformed, Medicare’s problem looms larger. Doing nothing about these entitlement programs only transfers the problems to the next generation. The challenge to the naysayers is to provide an alternative path to reform.
[page]Past earnings are indexed by a wage index which is calculated for each new group of retirees based on past average Social Security wages. The wage index is set to 1 for the year in which the retiree turns 60. Prior years’ index equals the ratio of the average Social Security wage in the year in which the retiree turns 60 divided by the average Social Security wage in those years. For ages above 60 until retirement, the index is set to 1; thus, earnings in these years are not indexed. This wage index in each year is then multiplied by the retiree’s annual earnings in each year up to the retirement year. The highest 35 of these indexed annual earnings amounts are determined and then added together. If a worker has fewer than 35 years of labor force participation the missing years are filled in with zeros. The sum of the 35 highest annual earnings is then divided by 420, the number of months in 35 years, to determine the worker’s average indexed monthly earnings or AIME.
NOTE: Nothing written here should be construed as necessarily reflecting the views of the National Center for Policy Analysis or as an attempt to aid or hinder the passage of any bill before Congress.
[page]- See Sita Nataraj and John B. Shoven, “Has the Unified Budget Undermined the Federal Government Trust Funds?” National Bureau of Economic Research, Working Paper No. 10953, December 2004, and Kent Smetters, “Is the Social Security Trust Fund Worth Anything?” unpublished monograph, June 2003.
- See Peter A. Diamond and Peter R. Orszag, “Reforming Social Security: A Balanced Plan,” Brookings Institution, Policy Brief No. 126, December 2003. Social Security’s Chief Actuary, Stephen C. Goss, scored the proposal and the evaluation can be found online here.
- Andrew J. Rettenmaier and Thomas R. Saving, “Social Security Reform without Illusion: The Five Percent Solution,” National Center for Policy Analysis, Policy Report No. 272, December 2004.
- Solvency memorandum from Stephen C. Goss, Chief Actuary of Social Security, to Bob Pozen, February 10, 2005.
- Following the outline of the President’s proposal, contributions are initially capped at $1,000 per year, but the cap rises in each year with the growth in Social Security average earnings plus $100, which also grows with average earnings. Eventually all workers, even those earning the taxable maximum, will be able to invest 4 percent of their earnings in a personal account. The calculations for the PRA component of the reform follow the portfolio assumptions used by the Social Security Actuaries to evaluate the Pozen proposal. Specifically, the accounts are assumed to be invested in 60 percent stocks, 24 percent corporate bonds and 16 percent government bonds while workers are between 21 and 57 years of age. The returns assumed are 6.5, 3.5, and 3.0 percent, respectively. The share of stocks begins to decline at age 57, reaching 20 percent by age 62. At retirement, the accounts are annuitized using the unisex conditional life expectancy and the government bond rate of return. Given that under the president’s proposal the accounts are assumed to be funded by additional borrowing rather than mandatory contributions, a parallel account or notional account and annuity are also calculated. This notional account is assumed to earn a rate of return equal to the government borrowing rate. At retirement, worker’s reformed benefits are further offset by the annuity value of the notional account. In this way the funding of the accounts does not affect the federal government’s balance sheet.
- See Andrew J. Rettenmaier and Zijun Wang, “Social Security Reform: Responding to the Critics,” National Center for Policy Analysis, Policy Report No. 279, September 2005, for an analysis of the frequency with which the accumulations in the personal accounts may fall short of the benefit offset account accumulations. In exchange for the benefit reduction through the reformed benefit formula, the enabling legislation could set the benefit offset to the minimum of the accumulation in personal retirement account and the notional account.
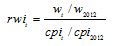 The real wage index begins in 2012, when the workers born in 1950 reach the age of 62. The real wage index rwi in year t is equal to:
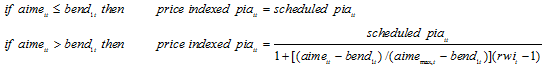 where w tis the Social Security average wage in year t, w 2012 is the Social Security average wage in 2012, cpi t is the consumer price index in year t, and cpi 2012 is the consumer price index in 2012. Lifetime earners whose average indexed monthly earnings are below the first bend point receive scheduled benefits while those whose earnings fall between the first bend point and the average indexed monthly earnings for maximum earners receive partial price indexed benefits as follows:
- Note that the reform could have alternatively been depicted with the top portion of each bar showing the net annuity (the annuity – the benefit offset) and the bottom portion showing the progressively price indexed benefit.
 Progressive price indexing as suggested by Bob Pozen begins with the calculation of a new bend point in the benefit formula at which indexation begins. Following the description in the solvency memorandum from Stephen C. Goss, chief actuary of Social Security, to Bob Pozen, February 10, 2005, we interpret the new bend point in year t to be equal to:
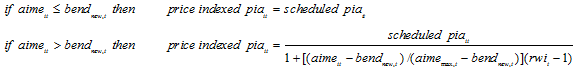 Lifetime earners whose average indexed monthly earnings are below the new bend point receive scheduled benefits while those whose earnings fall between the new bend point and the average indexed monthly earnings for maximum earners receive partial price indexed benefits as follows:
Dr. Andrew J. Rettenmaier is the Executive Associate Director at the Private Enterprise Research Center at Texas A&M University. His primary research areas are labor economics and public policy economics with an emphasis on Medicare and Social Security. Dr. Rettenmaier and the Center’s Director, Thomas R. Saving, have presented their Medicare reform proposal to U.S. Senate Subcommittees and to the National Bipartisan Commission on the Future of Medicare. Their proposal has also been featured in the Wall Street Journal, New England Journal of Medicine, Houston Chronicle and Dallas Morning News. Dr. Rettenmaier is the co-principal investigator on several research grants and also serves as the editor of the Center’s two newsletters, PERCspectives on Policy and PERCspectives. He is coauthor of a book on Medicare, The Economics of Medicare Reform (Kalamazoo, Mich.: W.E. Upjohn Institute for Employment Research, 2000) and an editor of Medicare Reform: Issues and Answers (University of Chicago Press, 1999). Dr. Rettenmaier is a senior fellow with the National Center for Policy Analysis.
Dr. Thomas R. Saving is the Director of the Private Enterprise Research Center at Texas A&M University. A University Distinguished Professor of Economics at Texas A&M, he also holds the Jeff Montgomery Professorship in Economics. Dr. Saving is a trustee of the Social Security and Medicare Trust Funds. His research has covered the areas of antitrust and monetary economics, health economics, the theory of the banking firm and the general theory of the firm and markets. He has served as a referee, or as a member of the editorial board, of several major U.S. economics journals and is currently an editor of Economic Inquiry. Dr. Saving has authored many articles and two influential books on monetary theory. He has been president of both the Western Economics Association and the Southern Economics Association. After receiving his Ph.D. in economics in 1960 from the University of Chicago, Dr. Saving served on the faculties of the University of Washington and Michigan State University, moving to Texas A&M in 1968. Dr. Saving served as chairman of the Department of Economics at Texas A&M from 1985-1991. Dr. Saving is a senior fellow with the National Center for Policy Analysis.