The United States spends about 17 percent of its national income on health care, the highest in the world. Some have wondered how high spending can go and what difference it will make. In thinking about that question, the experience of our senior citizens provides a vital clue.
- Today, more than two of every five dollars of total potential consumption by the elderly (43 percent) is health care.
- In just 17 years (by 2024), health care will equal 50 percent of seniors' total consumption.
- For the oldest seniors – age 75 and older – health care already makes up more than half of all they consume.
Much of seniors' health spending is paid not by seniors themselves, but by public and private third parties like Medicare, Medicaid and previous employers. However, as spending on their health care rises, seniors will be asked to devote an increasing share of their own incomes to pay for it, crowding out other items like food, housing and travel.
- Today, seniors spend 17.2 percent of their cash incomes on health care, on the average, including out-of-pocket expenditures, as well as premiums for Medicare and individually purchased Medigap insurance.
- That level will grow to almost one out of every four dollars of income (23.5 percent) by 2030, and by midcentury seniors will potentially spend almost one-third of their cash incomes (31.4 percent) on health care.
Another way to look at health care spending by the elderly is to compare their total health consumption to their money incomes:
- Including all the spending by third parties, an amount approaching two-thirds of seniors' cash incomes is currently spent on health care.
- In another three decades (by 2039), an amount equal to 100 percent of seniors' cash incomes will be spent on health care.
Since Social Security represents such a large portion of seniors' retirement income – particularly for older seniors – examining health spending as a percentage of Social Security benefits is also informative:
- Today's seniors spend from their own resources an amount equal to 44.5 percent of their Social Security benefits on health care.
- That amount will almost double (to 81.3 percent) by midcentury.
If health care spending rises as expected, seniors will likely be called upon to share the burden. That means current and future workers will need to extend their time in the labor market – or save and invest more money while working – to prepare for the higher expected health care costs waiting for them in retirement.
[page]America is aging. As the 77 million baby boomers enter their retirement years, the United States will experience an unprecedented shift of people out of the workforce and into retirement. This demographic change will pressure society – both workers and retirees – in many ways, but nowhere more than spending on health and medical care.
This paper examines total health spending on the elderly by all sources as a percentage of seniors' total potential consumption. By this measure, health care constitutes more than 43 percent of all consumption by the elderly; in less than 20 years, health care will constitute more than half of all consumption by the elderly.
“Health care spending for seniors will grow as baby boomers retire.”
This paper also documents seniors' out-of-pocket health spending (including premiums for Medicare and individually purchased Medigap insurance) as a portion of their cash incomes. 1 For example, seniors' spending on their own health care will grow to about 24 percent of their cash incomes within the next 25 years. This amount will equal 60 percent of their Social Security benefits. If retirees are asked to pick up more of Medicare's tab, which seems inevitable, the percentage of their incomes devoted to health care will rise.
Finally, this paper presents a snapshot of current retirees' health, sources of income, wealth and spending on medical care. 2 As seniors age, their health status declines, leading to higher health care spending and an increased dependence on government programs – that is, taxpayers – to pay for it.
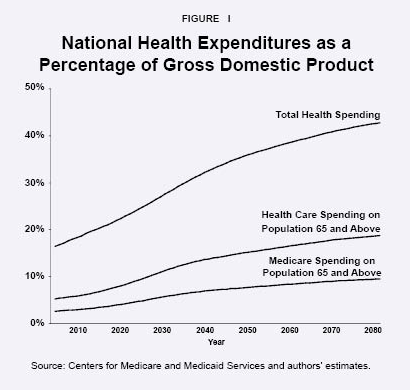
[page]The baby boomers are healthier and will live longer lives than previous generations. Longer life expectancies lead to 1) longer retirements, 2) a larger retired population and, inevitably, 3) higher medical expenses for the retired population. Consequently, health care spending on the over-65 population will rise at a brisk pace:
- The percentage of the U.S. economy spent on health care for the elderly – about 5.3 percent today – will more than double by 2030, and will nearly triple by midcentury. 3 [See Figure I.]
- Further, the share of total national health expenditures dedicated to the over-65 population will rise from 32 percent today to 44 percent by 2080.
Health Care Spending as a Percent of Total Consumption. If the predictions hold, total health care spending on the elderly – including both out-of-pocket spending by seniors and third-party expenditures – will constitute a growing portion of seniors' total potential consumption. "Total potential consumption" includes everything seniors can consume: All their personal income plus all health care expenditures by third parties on their behalf net of their own premium payments. 4
“The share of the economy spent on elder health care will more than double by 2030.”
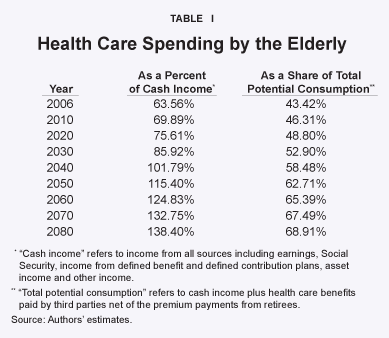
- Economist Victor Fuchs estimated that in 1997 health care represented 35 percent of the "full income" of Americans age 65 and older. 5
- Today, we estimate that more than two of every five dollars of consumption by the elderly (43 percent) is health care. [See Table I.]
- By 2024, health care will equal 50 percent of seniors' total consumption
- For the 75-plus population, it is already more than half.
In these estimates, long-term care is categorized as health care and thus the projections may overstate total health care given that much of the long-term care costs are associated with housing and food. Further, these projections do not account for any changes in the health care market that may alter the relative price consumers pay for health care. Changing incentives will affect consumers' willingness to allocate their budget toward health care and thus would change the associated shares of consumption.
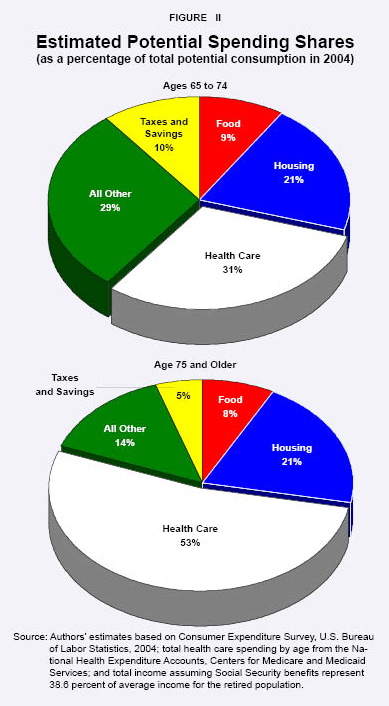
Health Spending versus Other Goods and Services. Health care's prominent role in the spending patterns of older Americans can be further illustrated by comparing its share of total potential consumption to spending on other goods and services. For all individuals age 65 and older, health care's percentage of total potential consumption (43 percent) dominates all the other categories, and is larger than housing, food, and savings and taxes combined. 6 As Figure II shows: 7
- For individuals ages 65 to 74, health care represents 30.6 percent of potential spending (Medicare and individually purchased medigap premiums and out-of-pocket spending are estimated to account for 8.7 percent, while third-party payments account for 21.9 percent).
- Among retirees age 75 and older, heath care already constitutes 52.5 percent of total potential consumption (Medicare and individually purchased medigap premiums and out-of-pocket spending account for 14.0 percent, while third-party payments make up 38.5 percent).
“Health care spending amounts to almost one-third of younger seniors' total consumption.”
“Health care spending amounts to more than one-half of older seniors' total consumption, on the average.”
[page]
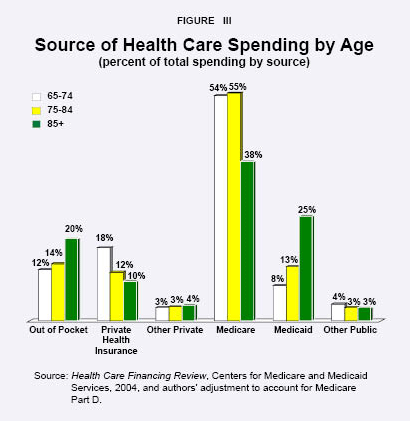
With the current financing arrangement, retirees will pay part of their rising health care costs out of pocket. 8 But the majority of the money comes from other sources, particularly public programs like Medicare and Medicaid. As Figure III shows:
“Spending on seniors' health care equals two-thirds of their cash income.”
- Seniors' out-of-pocket spending as a percentage of total health care spending increases with age, from 12 percent for seniors ages 65 to 74, to 20 percent for seniors age 85 and older.
- Private health insurance pays a lower percentage of total health care spending as seniors age, from 18 percent for the youngest seniors to 10 percent for the oldest seniors.
- Public programs pay for more than two-thirds of seniors' health care spending at all age groups; however, as seniors age, Medicare pays a lower proportion (decreasing from 54 percent to 38 percent) and Medicaid pays a larger proportion (increasing from 8 percent to 25 percent). 9
The Medicare percentages in Figure III include total reimbursements, which follow the definitions in the National Health Expenditure Accounts. However, since seniors' premium payments are included in the Medicare percentage, the Medicare percentage is overstated while out-of-pocket spending is understated. Further, private sources include payments made on behalf of seniors covered by individually purchased medigap policies as well as employer-sponsored insurance. If all premium payments were instead included along with the out-of-pocket amount, the percentage of total health care paid by seniors would rise 12.4 percentage points to 27 percent for all seniors, on the average. 10
“Public programs pay for more than two-thirds of seniors' health care spending.”
“Seniors may spend more than one-fourth of their income on health care by midcentury.”
Table II shows the increase in seniors' total personal expenditures on health – which includes both out-of-pocket spending (including estimated premium payments for individually purchased medigap insurance) and Medicare premiums – as a percentage of total income. In addition to the out-of-pocket health care spending depicted in Figure III, seniors pay for 25 percent of Medicare Part B expenditures and 23 percent of Medicare Part D through monthly premiums. Some also purchase individual medigap insurance policies. 11 Assuming these factors remain constant, as health spending rises, the proportion of seniors' own incomes spent on their health care will also rise, and they will have to reallocate their incomes to meet their medical needs.
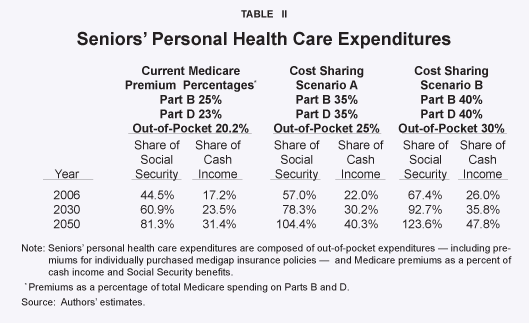
- Today, seniors dedicate 17.2 percent of their own cash incomes to health care spending, on the average.
- That level will grow to 23.5 percent by 2030, and reach 31.4 percent by 2050.
Thus, by midcentury, seniors will potentially spend almost one-third of their cash incomes on health care alone.
“Seniors' spending on health care amounts to more than one-third of their Social Security benefits.”
Recall from Table I that, including all the spending by third parties, an amount equal to almost two-thirds of seniors' incomes is spent on elderly health care. By this measure, in just 30 years, an amount equal to 100 percent of seniors' incomes will be spent on health care. This will undoubtedly require changes in government policy that will affect seniors' spending choices during retirement. 12
Since Social Security represents such a large portion of seniors' retirement income – particularly for older seniors – examining health spending as a percentage of Social Security benefits is also informative:
- Today's seniors spend an amount equal to 44.5 percent of their Social Security benefits on health care.
- The amount will rise to 60.9 percent by 2030 and to 81.3 percent by midcentury.
- By 2070, almost all (93.4 percent) of seniors' Social Security checks will be dedicated to spending on health and medical care.
Alternative Future Scenarios. The previous estimates assume current law related to Medicare premiums remains in effect. But, given the course of Medicare spending, it is likely the program will be changed in a way that reduces the costs for taxpayers and requires seniors to shoulder more of the burden. Further, if the cost-containment provisions of the 2003 Medicare Modernization Act come into play, policymakers may be forced to consider cutting costs and raising revenues sooner rather than later. [For more information on these provisions, see the sidebar "Pulling the Trigger on Medicare Reform."]
Since retirees will likely be called upon to share some of the growing burden of higher health care costs, Table II also presents two hypothetical cases with alternative cost-sharing arrangements. 13 In addition to the base case summarized in the first column, the other two cases assume the percentage of health spending borne by seniors increases and Medicare premiums are increased to cover a larger portion of the program's costs:
- Cost Sharing Scenario A : If seniors' out-of-pocket expenditures, which include individually purchased medigap insurance, climb to 25 percent of total health spending – and if seniors' premiums are increased to cover 35 percent of Medicare Parts B and D – seniors will spend 30.2 percent of their income on health by 2030, and 40.3 percent of their income by midcentury.
- That equates to 78.3 percent of average Social Security benefits by 2030, and 104.4 percent of Social Security benefits by midcentury.
- Cost Sharing Scenario B : If seniors' out-of-pocket expenditures as a share of total health spending climbs to 30 percent – and if sen-ior premiums are increased to cover 40 percent of Medicare Parts B and D – seniors will spend 35.8 percent of their income on health care by 2030, and 47.8 percent by midcentury.
- That equates to 92.7 percent of average Social Security benefits by 2030, and 123.6 percent of Social Security benefits by midcentury.
“Seniors will probably pay a greater percentage of the cost of health care in the future.”
Even if seniors pay a greater percentage of the cost of their health care, the taxpayer burden due to Medicare will rise. How the remaining burden will be shared between taxpayers and retirees remains an open question, but regardless of the solution, today's workers must take seriously the possibility of higher health care cost sharing as they plan for retirement. Baby boomers would do well to consider extending their time in the labor market – or saving and investing more while working – to prepare for the higher expected health care costs waiting for them in retirement.
“Health status declines with age.”
One reason health costs are projected to rise is because Americans are living longer and will spend longer periods of their lives in retirement. While the soon-to-retire baby boomers are healthier and wealthier than previous generations, their physical and cognitive abilities will still decline as they age. This will, in turn, lead to an increase in medical care utilization.
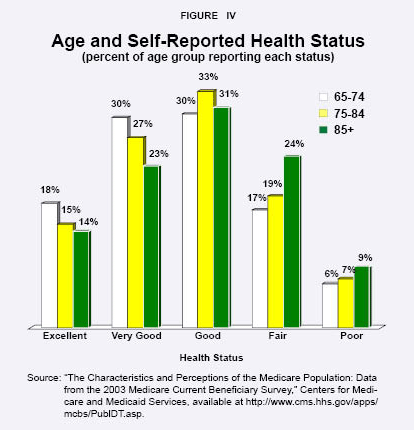
Health Status Declines with Age. Self-reported health status is a common indicator of physical well-being. Figure IV shows how three groups of seniors – ages 65 to 74, ages 75 to 84, and age 85-plus – rank their own health status: 14
- Within each age group, 30 percent or more say they are in good health.
- Among the younger seniors, 47 percent report excellent or very good health, versus only 36 percent of the oldest retirees.
- In contrast, 33 percent of the oldest seniors identify their health as fair to poor, versus only 23 percent of the younger group.
“The oldest seniors have more physical limitations, on the average.”
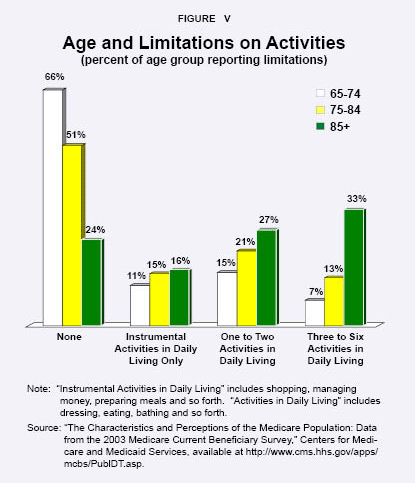
Another way to measure the age-related decline in health is the ability to perform daily activities. Two ways to measure this include "Instrumental Activities in Daily Living" and "Limitations in Activities in Daily Living," which are both reported by the Centers for Medicare and Medicaid Services. [See Figure V.] Instrumental activities in daily living are those considered necessary for independent living, and include managing money, shopping, performing housework and the like. Persons who have difficulty performing or are unable to perform these activities are categorized as having a limitation; the percentage of individuals with instrumental limitations rises from 11 percent of younger seniors to 16 percent for the oldest. Limitations in activities in daily living – including dressing oneself, eating, bathing and so forth – also rise with age; those with one or two of these limitations rises from 15 percent of younger seniors to 27 percent of the oldest.
The notion that retirees' health status declines with age is supported by other measures as well, including upper extremity limitations, mobility limitations, the increased prevalence of chronic conditions, and the deterioration of hearing and eyesight.
“Seniors are healthier and have longer life expectancies than previous generations.”
Quality of Life at Any Given Age Is Increasing over Time. While it is true that individuals are living longer, eventually their physical and mental abilities will deteriorate along with their earning potential. But over time the quality of life at any given age has improved. In a paper published in the Journal of Political Economy , researchers Kevin M. Murphy and Robert H. Topel find that while quality of life generally decreases with age, it has improved over time for every age group. 15
Similarly, research by David M. Cutler and Elizabeth Richardson suggests quality of life decreases with age because the prevalence of most chronic conditions increases with age. 16 At the same time, however, quality of life has improved over time for those who suffer from most chronic conditions due to advances in medical technology that reduce associated debilitating effects or functional limitations.
Clearly, as the baby boomers age and the incidence of chronic conditions among them increases, demand for health care and medical spending will rise, increasing the strain – not only on their own incomes, but on taxpayers as well.
[page]The incomes and wealth of older Americans are greatly affected by government programs such as Medicare and Social Security. They represent mortality-contingent wealth in the form of transfers from the young. Seniors are also affected by tax and employment policies that influence their decision to work, earn labor earnings and leave bequests. As noted, even though older Americans' medical care is highly subsidized, rising costs will require increasing shares of seniors' budgets. This is particularly true if a cost-sharing shift moves more of the burden onto the elderly population. It is instructive, then, to examine the income and wealth status of older Americans. The conclusion: Income and wealth decline with age, while dependence on Social Security increases.
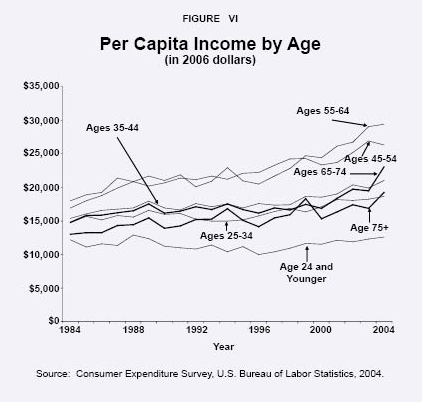
Income of the Elderly. Figure VI presents per capita income (in 2006 dollars) for households headed by individuals at various ages. Each line traces annual per capita income between 1984 and 2004 for different age groups. According to the figure:
- Real income grew for each age group with the exception of the age-24-and-younger group, which remained relatively constant.
- Those in their peak earning years – ages 45 to 64 – have the highest incomes.
- The per capita income of the aged population – age 65 and older – has been similar over the last two decades to households headed by individuals ages 25 to 44.
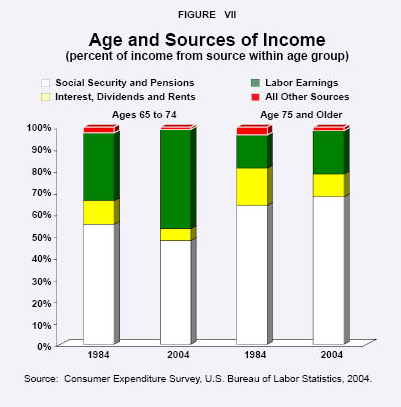
Sources of Income Change as Individuals Age. As individuals move through the conventional retirement years, sources of income change dramatically. Among younger seniors – ages 65 to 74 – Social Security and pensions are a major source of income. But in recent years the importance of labor income has grown:
- In 1984, Social Security and pensions accounted for 55.1 percent of income, and labor earnings constituted 31.3 percent. [See Figure VII.]
- By 2004, Social Security and pensions were only 47.7 percent of income, and labor market earnings rose to 45.7 percent.
“People ages 45 to 64 have the highest average income.”
The rise in labor income is a result of increased labor market participation among these workers, which can be attributed in large part to the elimination of the Social Security earnings test for those who reach the normal retirement age. 18 In fact, in 2005, 28.3 percent of individuals ages 65 to 69 were in the labor force, compared to 16.3 percent of those ages 70 to 74, and only 6.4 percent of individuals age 75 and older.
In contrast to the younger retirees, the importance of each income source has been relatively constant for individuals age 75 and older. The figure shows that, compared to the younger seniors, the importance of Social Security and pensions are higher and labor income much lower. Over time, for the older seniors, Social Security and pensions averaged 70.8 percent of income; labor earnings averaged 12.6 percent; interest, dividends and rents averaged 14.2 percent; and all other sources averaged 2.4 percent.
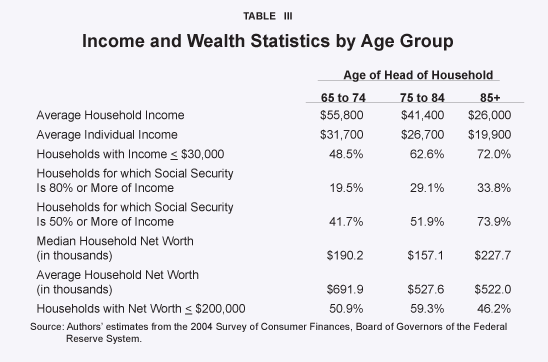
As Incomes Fall, Dependence on Social Security Rises. The information above from the Consumer Expenditure Survey is corroborated by the 2004 Survey of Consumer Finances. 19 The major income and wealth statistics are presented by age group in Table III. As expected, income and net worth falls with age while dependence on Social Security rises.
“Almost half the income of younger seniors in 2004 was from work, on the average.”
- Average household income falls from $55,800 for seniors ages 65 to 74, to $41,400 for seniors ages 75 to 84, and to $26,000 for seniors age 85 and older.
- Some of the decline results from the lower number of people per household in the older age categories; even so, the distribution of per capita income declines with age, too.
- The respective per capita annual incomes from youngest to oldest age groups are $31,700, $26,700 and $19,900.
“Seniors' per capita income falls with age.”
As seniors age, household incomes fall. Across all age groups, most households (56.8 percent) had incomes of $30,000 or less. By contrast, for households headed by a 65- to 74-year-old, 48.5 percent had incomes of $30,000 or less, while the proportion rose to 62.6 percent for households headed by individuals ages 75 to 84, and to 72.0 percent for those age 85 and older.
The survey data also show that as seniors age, Social Security benefits account for a greater portion of income:
- Social Security accounts for 80 percent or more of income in 19.5 percent of the households headed by 65- to 74-year-olds, 29.1 percent of the households headed by 75- to 84-year-olds, and more than a third of the oldest age group.
- Similarly, Social Security represents half or more of income in 41.7 percent of the households headed by people 65 to 74 years of age, 51.9 percent of the households headed by people 75 to 84 years of age, and 73.9 percent of the oldest age group.
Wealth of the Elderly. The "net worth" of the elderly population falls with age. A family's net worth is the combination of financial assets (stocks, bonds, mutual funds, retirement accounts, and savings and checking accounts) and nonfinancial assets (real estate, vehicles and so forth), less any debts.
“Seniors' household wealth falls with age.”
As noted, the primary sources of income for older Americans are pensions and Social Security. They provide flows of income to retirees, but are seldom measured as wealth. That is, the mortality-weighted expected present values of such flows are not typically counted as assets by individuals or families. In contrast, the accumulated value of mutual or money-market funds in a defined contribution plan is counted as an asset and included in wealth. Such funds differ from pensions and Social Security in that they are not contingent on mortality. Further, primary residences and vehicles are not reported as income, but are included in measures of wealth.
“Older seniors spend more on health care.”
As Table III shows, the median and average net worth for households headed by individuals ages 65 to 74 was $190,000 and $692,000, respectively; the few seniors with very high net worth skew the average, so it is much higher than the median net worth. In general, the values decline with age; interestingly, the oldest age group has the highest median net worth.
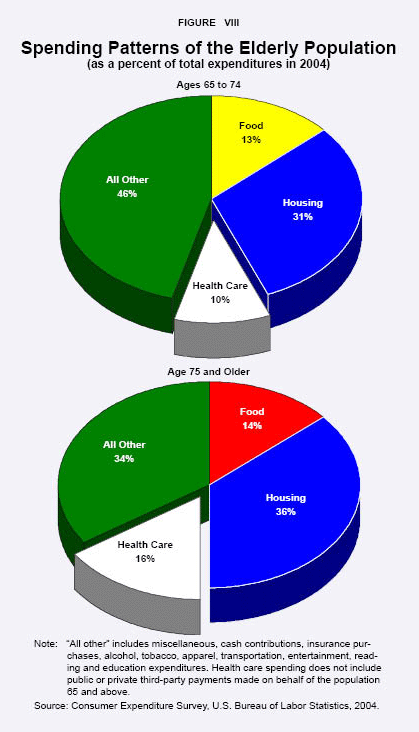
Spending Patterns of the Elderly. In 2004, 30.5 percent of the total spending of seniors ages 65 to 74 was on housing, 13.3 percent on food and 45 percent on other goods; meanwhile, health care spending averaged only 10.4 percent. 20 Health spending is somewhat higher for seniors age 75 and older, averaging about 15.5 percent of their total spending. [See Figure VIII.]
The spending patterns of the elderly population as noted for 2004 are indicative of the patterns that have existed over the past 20 years. This is true even in the case of out-of-pocket health care spending, since rising health costs have been borne largely by public and private third-party payers. Given the growth in Medicare premiums – and the likelihood of increasing pressure to shift a greater portion of the cost onto seniors – the elderly will see an increasing portion of their household budget consumed by health care costs.
[page]Increasing life expectancies, rising spending per retiree and a growing retired population are fueling higher health care expenditures for the elderly population. The health care cost borne by retirees is projected to rise substantially, even under current-law projections. If the cost sharing shifts and seniors are asked to pay more of their own health care costs, health care will crowd out other spending options for future retirees. Current workers must anticipate these changes, and will have to consider staying in the workforce longer, saving more or consuming less health care as the relative price of health care increases.
“Current workers will have to consider working longer, saving more or consuming less health care in retirement.”
The rising costs of medical care – and the growing portion of seniors' incomes dedicated to health care – will prompt policymakers to consider ways to reduce the burden of health spending on behalf of and by seniors. One way to lessen the burden is to encourage workers to save money today for their own elderly health care by allowing them to prepay part of their Medicare benefits, or by expanding Health Savings Accounts (HSAs) and allowing Medicare-eligible seniors to open and make deposits to HSAs to cover out-of-pocket health expenses.
NOTE: Nothing written here should be construed as necessarily reflecting the views of the National Center for Policy Analysis or as an attempt to aid or hinder the passage of any bill before Congress.
[page]- This study is motivated by a series of papers by Victor Fuchs. In those papers, Fuchs projected health care spending by the elderly, examined the degree of income inequality, noted the importance of transfers from the young in providing consumption for the elderly and pointed to the need for additional savings and work prior to retirement. See Victor R. Fuchs, "Provide, Provide: The Economics of Aging," in Andrew J. Rettenmaier and Thomas R. Saving, eds., Medicare Reform: Issues and Answers (University of Chicago Press: 1999), pages 15-36. See also Victor R. Fuchs, "The Financial Problems of the Elderly: A Holistic Approach," National Bureau of Economic Research, Working Paper No. 8236, April 2001.
- The health-related summary measures are from the Centers for Medicare and Medicaid Services' 2003 Medicare Current Beneficiary Survey, as well as the 2003 Health and Nutrition Examination Survey. Income data are from the Federal Reserve's 2004 Survey of Consumer Finances (SCF) and the U.S. Bureau of Labor Statistics' 2004 Consumer Expenditure Survey. Wealth data is derived from the 2004 SCF data file. Total medical care spending is from the Centers for Medicare and Medicaid Services' 2004 National Health Expenditure Accounts.
- Medicare's total percentage of gross domestic product (GDP) is reduced by the total estimated spending on disabled beneficiaries to arrive at the series identified as Medicare spending on the population age 65 and above. Total health care spending for this age group is computed assuming medicare will pay for approximately 51 percent of the retired population's health care spending in all future years.
- Total potential consumption is calculated by adding together seniors' total per capita income and total per capita health care spending, less the amount seniors pay from their own income (out-of-pocket health care spending, and premium payments for Medicare and privately purchased medigap insurance). For the purpose of this examination, taxes are not taken into account.
- Victor Fuchs' definition of "full income" is similar to the terms "total potential consumption" or "spending" in this paper. Fuchs also projects that health care spending as a share of full income will range from 40 percent to 52 percent by 2020 when the growth rate in per capita health care spending is between 1 and 3 percentage points higher than the growth rate in per capita GDP excluding health care. This paper estimates that, by 2020, health care will comprise 48.8 percent of total potential consumption for older Americans. For more information, see Victor R. Fuchs, "The Financial Problems of the Elderly: A Holistic Approach," National Bureau of Economic Research, Working Paper No. 8236, April 2001. Total income is estimated based on projected Social Security income per retiree. Social Security is assumed to represent 38.6 percent of average income in all future years. Setting the Social Security share to 38.6 percent for all retirees is based on the Social Security Administration 2004 Income of the Aged Chartbook. Calculating the Social Security share from the Survey of Consumer Finances results in about a 33 percent share of average per capita income while the 2004 Current Population Survey produces a higher 45 percent share. Seniors' total health care consumption is derived from the Medicare projections from the 2006 Trustees reports assuming that Medicare spending accounts for 51 percent of seniors' total health care spending in all future years.
- We estimate that 27 percent of total health care spending is paid by retirees either in the form of out-of-pocket spending or as premium payments.
- Spending patterns for the elderly from the Consumer Expenditure Survey are presented in a later section of this paper. The 2004 Consumer Expenditure Survey estimate of health care spending as a percent of total income for all households headed by individuals age 65 and older is 11 percent. Including the insurance purchases category raises the total to 15.7 percent of income. Because the Consumer Expenditure Survey is limited to the non-institutionalized population, it therefore omits the 7 percent of the population who are in a long-term care facility sometime during the year. This paper uses the authors' estimates of health care spending as a percent of income by age group and adjusts the "all other" category from the Consumer Expenditure Survey. In 2006, we estimate that 17.2 percent of seniors' incomes is allocated to health care spending in the form of out-of-pocket spending and Medicare and individually purchased medigap premium payments. Figure II combines shares from the Consumer Expenditure Survey data for individuals age 65 and older with the estimates of total income and health care spending which underlie the other estimates in this paper.
- Medicare has three parts. Medicare Part A (Hospital Insurance) benefits are funded by a payroll tax on wages. Medicare Part B (Supplemental Medical Insurance) is funded three-fourths by taxpayers and one-fourth by premiums paid by beneficiaries. The newly created Medicare Part D (prescription drug benefits) is funded 77 percent by taxpayers and 23 percent by beneficiary premiums, although some of these premiums are paid by the states for dual-eligible beneficiaries.
- A recent study by Keehan, Lazenby, Zezza, and Catlin (2004) allows one to infer the sources of health care payments for older Americans. See Sean P. Keehan, Helen C. Lazenby, Mark A. Zezza and Aaron C. Catlin, "Age Estimates in the National Health Accounts," Health Care Financing Review , Web Exclusive, Vol. 1, No. 1, December 2, 2004; available at http://www.cms.hhs.gov/apps/review/web_exclusives/keehan.pdf. Because of the addition of prescription drug benefits to the Medicare package with the passage of the Medicare Modernization Act in 2003, the sources of payment data are adjusted to reflect this change. The age tables include out-of-pocket spending, private insurance, other private sources, Medicare, Medicaid and other public payment sources. Spending is also broken down by types of services including: hospital, physician services, prescription drugs, nursing homes, dental, other professional, other personal, home health, nondurables and durables. The shares by payment source associated with physician services are assigned to the prescription drugs category and the shares are recomputed within each age classification. In doing so, Medicare's share rises from 46 percent to 51 percent of total spending for the population 65 and above, based on the most recent estimates (1999). For comparison, Medicare's share of total health care spending by the retirement age population was 46 percent in 1987 and 49 percent in 1996, based on CMS estimates.
- The shares of private insurance spending allocated to individually purchased medigap insurance is based on the age distribution of private insurance coverage for community residents from Table 1.6 in Health and Health Care of the Medicare Population: Data from the 2002 Medicare Current Beneficiary Survey (Rockville, Md.: Westat, 2006).
- These amounts are denominated by average Social Security benefits across all retirement-age beneficiaries and by average total retiree income where total income is estimated as before.
- These estimates have been based on applying multiples to projected per capita Social Security and Medicare benefits. They illustrate the implications of the current projections that health care expenditure growth is faster than the expenditure growth on other goods. It is possible that both health care expenditures and spending on all other goods rise with retirees' incomes, even though the share spent on health care can rise while the share on other goods falls. But if health care cost sharing rises too quickly, such that retirees are faced with the possibility of falling real consumption on other goods, they will opt for less health care spending growth so that both their health care spending and other spending rise with rising incomes.
- These results do not take into account the behavioral responses on the part of retirees that will result from increased cost sharing, nor do they include the possible supply responses on the part of health care providers.
- "The Characteristics and Perceptions of the Medicare Population: Data from the 2003 Medicare Current Beneficiary Survey," Centers for Medicare and Medicaid Services. Available at http://www.cms.hhs.gov/apps/mcbs/PublDT.asp.
- Kevin M. Murphy and Robert H. Topel, "The Value of Health and Longevity," Journal of Political Economy , Vol. 114, 2006.
- David M. Cutler and Elizabeth Richardson, "Measuring the Health of the United States Population," Brookings Papers on Economic Activity: Microeconomics, 1997.
- Data for this section is derived from the Consumer Expenditure Survey (CEX) sponsored by the Bureau of Labor Statistics and the Survey of Consumer Finances sponsored by the U.S. Federal Reserve. The CEX is primarily used to define the basket of goods and their weights in the Consumer Price Index (CPI). The CEX data is summarized by consumer units, or groups of individuals who share financial resources. These groups are typically families or households. The age used in the figures based on the CEX data is the age of the reference person, or the person in the consumer unit who owns or rents the residence.
- For a discussion of the effects of this change on the labor market participation among older workers, see Liqun Liu and Andrew J. Rettenmaier, "Work and Retirement," National Center for Policy Analysis, Policy Backgrounder No. 162, November 3, 2006; available at http://www.ncpathinktank.org/pub/bg/bg162/.
- The Survey of Consumer Finances sponsored by the Board of Governors of the Federal Reserve System is a triennial survey of the balance sheet, pension, income and other demographic characteristics of U.S. families.
- Consumer Expenditure Survey, U.S. Bureau of Labor Statistics, 2004. In the Consumer Expenditure Survey, health care primarily refers to out-of-pocket spending on medical care and does not include pretax employer premium payments or Medicare reimbursements on behalf of retirees. See footnote 6 for additional discussion of the Consumer Expenditure Survey.
Dr. Liqun Liu is a Research Scientist at the Private Enterprise Research Center at Texas A&M University. His primary research areas are taxation analysis and evaluation of government expenditures. His current focus is on the effects of reforming elderly entitlements. Dr. Liu serves as an investigator on several research grants. He has published papers in the National Tax Journal, Economic Inquiry, Journal of Institutional and Theoretical Economics, Review of Economic Design, Southern Economic Journal and Journal of Public Economics .
Dr. Andrew J. Rettenmaier is the Executive Associate Director at the Private Enterprise Research Center at Texas A&M University. His primary research areas are labor economics and public policy economics with an emphasis on Medicare and Social Security. Dr. Rettenmaier and the Center's Director, Thomas R. Saving, have presented their Medicare reform proposal to U.S. Senate Subcommittees and to the National Bipartisan Commission on the Future of Medicare. Their proposal has also been featured in the Wall Street Journal, New England Journal of Medicine, Houston Chronicle and Dallas Morning News . Dr. Rettenmaier is the co-principal investigator on several research grants and also serves as the editor of the Center's two newsletters, PERCspectives on Policy and PERCspectives . He is coauthor of a book on Medicare, The Economics of Medicare Reform (Kalamazoo, Mich.: W.E. Upjohn Institute for Employment Research, 2000) and an editor of Medicare Reform: Issues and Answers (University of Chicago Press, 1999). He is also coauthor of Diagnosis and Treatment of Medicare (forthcoming American Enterprise Institute Press, 2007). Dr. Rettenmaier is a senior fellow with the National Center for Policy Analysis.
Dr. Zijun Wang is an Associate Research Scientist at the Private Enterprise Research Center at Texas A&M University. His primary research interests are econometric forecasting, empirical consumption analysis and health economics. Dr. Wang has published in the Journal of Forecasting and has presented his research on stock market volatility at an international conference. He has served as a referee for Economic Inquiry . Before coming to the United States, Dr. Wang published several papers on the Chinese economy, and is the coauthor of Road Toward Market Economy (Beijing: Xinhua Press House, 1993). Dr. Wang has worked extensively on Medicare and Social Security research since he joined the Private Enterprise Research Center.