One of government’s biggest challenges is to develop policies that raise the standard of living in a society without creating large income gaps between the rich and poor. But to a great extent, raising living standards and redistributing income are mutually exclusive goals.
Up to some level, government can contribute to economic growth by building infrastructure, expanding educational opportunities, and providing for national defense and public health. Beyond these activities, however, government intervention in market outcomes tends to be about income redistribution. Taxation reduces incentives to work, save and invest. If tax revenue is merely redistributed from some people to others, rather than spent on raising productive potential, the net consequence will be lower national income.
This study examines the effect of economic freedom on economic growth and income inequality. It also examines the trade-off between income inequality and economic growth. It includes data for 26 advanced countries, including some newly industrializing Asian nations.
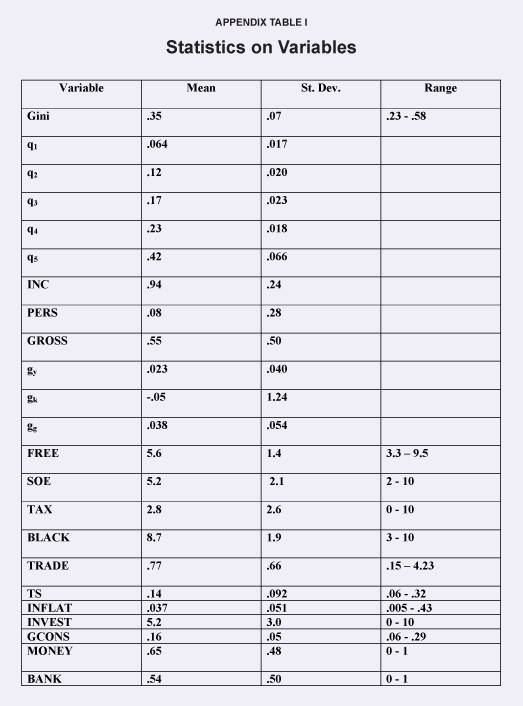
It measures economic freedom by constructing an index based on 10 components of government policy, including the share of government-owned enterprises in the economy and the top marginal tax rates. Income inequality is measured as market-based income, as represented by a Gini coefficient, which ranges from 0 (meaning everybody has the exactly the same income) to 1 (meaning one person has all the income). Economic growth is defined as the real growth in per capita gross domestic product (GDP) in U.S. dollars.
All else equal, the central findings are:
- Freer economies enjoy higher rates of economic growth than less free ones.
- Freer economies are more equal economies; economic freedom reduces inequality by increasing the share of market income going to the poor and lowering the share going to the rich.
- Economic growth increases income inequality, but the effect is small.
- Overall, the increase in inequality from economic growth is outweighed by the reduction in inequality caused by greater economic freedom — creating a net benefit to lower income groups.
Conversely, nations in which the government more aggressively redistributes income have significantly lower rates of economic growth. In the long run, this income redistribution hurts the poor. For example, among the countries analyzed in this study:
- Lowering a country’s Gini coefficient by 0.01 would require reducing the income share of the rich by 0.6 percent and redistributing it to others.
- However, this would lower the economic growth rate by 1.6 percentage points (from 2.3 percent to 0.7 percent).
- With the transfer, but a lower growth rate, average household income in the lowest group would reach only $8,050 after 25 years, instead of the $10,320 that would be achieved without the transfer.
This study confirms that a relatively free market with a limited role for government will, over time, produce the greatest economic benefits for the lowest income earners.
The higher income brought about by economic growth ultimately raises the incomes of low-income households more than an increase in the equality of incomes brought about by a redistribution of income.
[page]Perhaps the single most important political question of the past century has been how to construct government policy so that the standard of living rises and all income classes benefit from increased prosperity. This debate remains with us today. The political parties of the right and left (or center-right and center-left) are separated by their respective emphasis on government programs and policies that promote economic growth or those that redistribute income among citizens. To a great degree, raising living standards and redistributing income are mutually exclusive goals.
“Economic freedom promotes economic growth.”
Promoting economic growth predominantly entails government getting out of the way of personal decision-making and free market activity and exchange. Yet government can contribute to economic growth by providing infrastructure, expanding educational opportunities, protecting property and contracts, and providing for national defense and public health. Economic growth requires a fiscal state of some size and perhaps some intervention in market outcomes where market failure occurs.2
Such activities, up to some level, are growth-promoting. However, beyond a certain size, taxation, transfers and subsidies and other market interventions are about income redistribution. These political interventions have a price. As economist Arthur Okun pointed out long ago, transfers are made with a “leaky bucket” — a loss of national output arising from income distribution.3 This trade-off between economic growth and income inequality, and the link to the amount of government intervention in market outcomes is widely understood by both economists and politicians.
A History of Economic Freedom. Throughout the last two centuries, economists and politicians on both sides of the Atlantic have struggled with the question of how much government intervention is required to balance the trade-off between economic growth and income inequality. In the 19th century, thanks largely to Adam Smith, the English economy was freed of massive state control. England adopted free trade and a general policy of benign neglect of the economy. The Industrial Revolution led to the movement of peasants from the countryside to the cities and the Dickensian squalor of factory and urban life.
Before 1850 an Englishman or an American could expect to be dead before age 40, but by the early 1900s he could expect to live past age 50. The longer life span was in large part due to public measures like conveying potable water to the cities, garbage pickup and sewage disposal. But the increase in life expectancy was also due to the rising standard of living brought about by economic growth.4
The Introduction of the Progressive Income Tax. With economic freedom and economic growth, the gap between the rich and poor widened, and was filled by a growing middle class. Because the middle class became so numerous, it became feasible to do something about the less fortunate.5 In the mid-19th century England introduced the progressive income tax. Although there had been pressure from populists and progressives in the United States, the first income tax was not introduced until the U.S. Civil War.6
The Socialist Influence. Concern for income inequality rose with the socialists, who became active in France, Germany and England in the second half of the 19th century. Ultimately, to one degree or another, the political parties of the left adopted much of the agenda of the socialists. (For example, the British Labor party is a democratic socialist party, as are most of the leftist parties in Europe.) Their schemes, which took decades to implement and which remain with us today, included progressive (often punitive) taxation, public welfare plans and subsidies, and state-provided housing, schooling and medical care. The socialists also promoted protectionism and state ownership of natural monopolies, failing industries, the commanding heights of the economy (for example, steel, automobiles, mining and transportation) and so on.7
“Governments transfer money from rich to poor to reduce inequality.”
Government Intervention at Work. Most societies, ours included, do not like the distribution of income that occurs in free-market economies. There are too many poor, and the rich have too much wealth. The justification for market intervention and income redistribution by the state is that the gap between the haves and have-nots is too wide. Thus, over the decades, governments in advanced nations have intervened in market outcomes deemed politically and socially unacceptable by imposing high marginal tax rates, estate taxes, minimum wages or incomes policies; instituting worker rights to job security and a variety of job benefits; creating social security, Medicare or state-run health services; and implementing price controls, regulations and a variety of other policies and programs. These interventions in market outcomes adversely affect the efficiency of the economy and lower the rate of economic growth. They do so by introducing distortions into the economy and altering the incentives that affect individual choice. Government programs and policies alter prices in the economy, and hence alter the allocation of resources from their distribution to the highest valued use that would occur in a free market to a distribution that is more politically and socially acceptable. This government-induced reallocation of resources lowers the efficiency of the economy, and lowers the rate of economic growth.
Economic Freedom at Work. In a free market, capital, labor, land, entrepreneurial talent and so forth seek the highest returns possible from employment at their highest valued uses. These returns are their remunerations. In equilibrium, these factors of production earn an amount equal to the value of the increment in output that they produce. When this equilibrium is reached, the economy is producing the maximum amount of output with its scarce resources and existing technology. A free market will produce its output most efficiently, and simultaneously there will be an income distribution associated with that efficient production. In a free society, people are free to choose. They can stay in school or drop out. They can take a job that requires hard work and effort, or one that is less taxing and rewarding. They can save for an emergency or retirement, or they can spend every dime they make. They can insure against risk, or gamble with fate. All of these choices, and others, contribute to where they wind up in the income distribution.
Using data for many advanced countries and for some newly industrializing Asian nations, this paper examines the effect of economic freedom on economic growth and on income distribution, as well as the trade-off between economic growth and income inequality. [See the Appendix and Appendix Table for model details.]
[page]"Increases in economic freedom are associated with increases in economic growth."
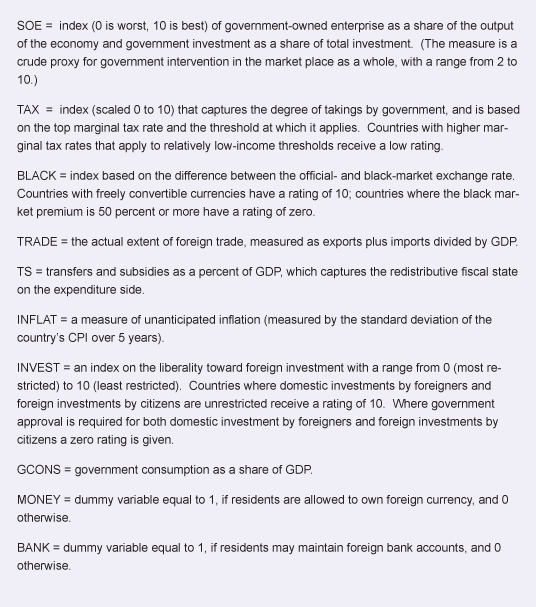
 Economic freedom is the right of individuals to engage in economic activity free of government control and intervention. The best measure of economic freedom currently available is that provided by James Gwartney, Robert Lawson and Walter Block.8 They measure economic freedom on a scale from 0 (worst) to 10 (best). Economic growth is defined as the real growth rate in per capita gross domestic product (GDP) in U.S. dollars.
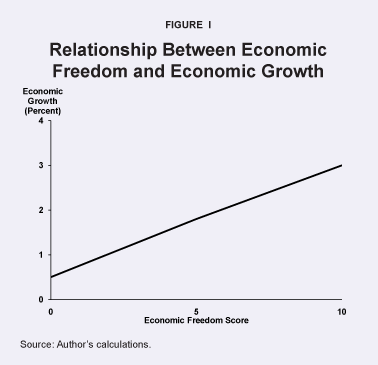
For the countries in the sample,9 the effect of a one-unit increase in economic freedom (say, from 5.0 to 6.0) is an increase in the economic growth rate of about one-quarter of a percentage point (for example, from 2.0 to 2.25 percent). Figure I shows the relationship between the index of economic freedom and the growth rate.
- The average growth rate among the countries in the sample is 2.3 percent, and the average value of the economic freedom index is 5.6.
- The range in the freedom measure among these countries is from 3.3 to 9.5, a spread of 6.2.
- This difference multiplied by a quarter of a percentage point in the growth rate yields a predicted spread in the per capita growth rates of 1.5 percentage points, which is a substantial difference.
"Increases in economic freedom are associated with less income inequality."
Thus, differences in economic freedom greatly affect the rate of economic progress among the nations of the developed world.
"Government transfers to reduce inequality reduce economic growth."
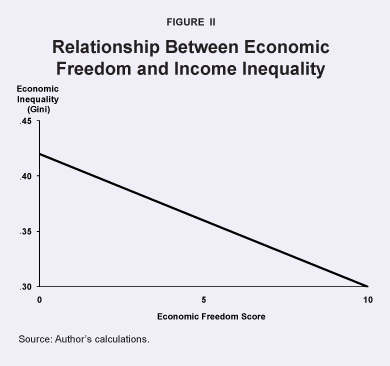
The most popular single measure of income inequality is the Gini coefficient. The Gini coefficient measures the difference between the actual distribution of income among the population and an equal distribution of income. The Gini coefficient is bound between zero (a perfectly equal distribution of income) and 1 (a perfectly unequal distribution of income). If the Gini is equal to zero, everybody has exactly the same income. If the Gini is equal to 1, one person has all of the income and the rest of the population has none. Thus, the higher the value of the Gini coefficient, the more income inequality in a society. 10 Figure II shows the relationship between economic freedom and income inequality:
- The effect of a one-unit increase in economic freedom, holding the economic growth variable constant, is to lower the Gini coefficient by 0.012 points (say, from 0.35 to 0.338).
- This means that nations that have more economic freedom have a more equal income distribution.
Multiplying the difference in the range of economic freedom among these advanced and newly industrializing nations (6.2) by the decrease in the Gini coefficient (0.012) results in a predicted spread in the Gini coefficient of 0.074 points. This is not terribly large, since the Gini coefficients among these countries range from 0.23 to 0.58, a difference of 0.35.
[page]It is widely believed that nations with high rates of economic growth pay for this progress with more income inequality among their citizens. This is true for the advanced countries studied here. The relationship is shown in Figure III.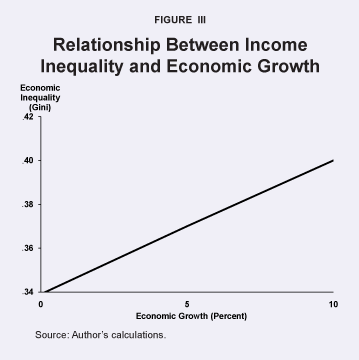
- For the countries in the sample, the dispersion in the growth rates is from -1.8 to 6.3 percent, a difference of 8.1; over this range in growth rates, the predicted difference in the Gini coefficient is 0.05 (say, from 0.325 to 0.375).
- Estimation of the trade-off rate indicates that a one percentage point increase in the growth rate is associated with an increase in the Gini coefficient of about 0.006 (say, from 0.350 to 0.356).
- Another way of looking at this issue is to ask what a reduction in income inequality costs; an improvement in the Gini of 0.01 costs 1.6 percent per year in per capita economic growth.
Thus, higher rates of economic growth are paid for with small increases in income inequality. But the increases are more than offset by the greater effect of economic freedom on reducing inequality. Put differently, economic freedom’s effect on increasing economic efficiency — allowing for greater distribution of income — outweighs its effect on increasing inequality through economic growth.
"Economic growth slightly increases income inequality."
Economic Freedom and the Trade-off among Income Classes. A disadvantage of the Gini measure is that there is no unique correspondence between changes in the measure and the underlying income distribution. That is, redistribution from the top to the middle or the middle to the bottom may yield the same value of the Gini coefficient. Partly for this reason, but also because there is more information in the quintiles, the relationships using quintile income shares as the dependent variable are examined.11
What is of particular interest is the opposite effect of economic freedom and economic growth on the income shares of the high- and low-income groups.
- Increases in economic freedom raise the income share of the poor relative to that of the rich.
- Changes in economic freedom have no apparent effect on the income share of the middle class.
- Increases in economic freedom lower the share of the highest income quintile.12
For the advanced nations, an increase in economic freedom positively affects the poorest income class and negatively affects the richest income class, but has no effect on the middle class.
The effect of economic growth on income shares is just the opposite. The poor experience a negative effect on their share of income from economic growth, while the highest income quintile experiences a positive effect. The effect of economic growth on the income share of the middle class is negative, but it is not a very large effect.
These results are consistent with the finding of its effect on the Gini coefficient, previously discussed. A one percentage-point change in the growth rate was associated with an increase in the Gini coefficient of 0.006. A one-point increase in the growth rate raises the share of income going to the highest income quintile by 0.64 percentage points and, of course, lowers the share of income going to the other income quintiles by an equivalent percentage.
"The net effect of increases in economic freedom is less inequality."
Measuring Economic Progress. Given the trade-offs, what matters more for a family’s economic progress — more equality in the distribution of income or the higher income brought about by economic growth? While all sorts of changes in the income distribution will alter the Gini measure, consider the simple case of taking money from the rich (those in the highest income quintile, or 20 percent) and giving it to the poor (those in the lowest income quintile, or 20 percent). How much would the income share of the rich have to decline, with that income given to the poor, to lower the Gini income inequality measure one point? The answer is roughly 0.6 percentage points (say, from a share of 46.0 to 45.4 percent). In dollar terms:
- Using U.S. income data for 1987, a reduction of 0.6 percentage points in the income share of the highest income quintile would transfer $920 to each household in the lowest income quintile.13
- This would raise the average annual income of those in the lowest quintile from $5,842 to $6,762, but the price paid for this transfer would be a lowering of the growth rate from 2.3 percent to 0.7 percent per annum.
In the long run, this reduction in growth would hurt the poor.
- Without the transfer, the real annual income in the lowest quintile would grow to $10,320 after a generation.
- With the transfer and the lower growth rate, average yearly household income for the poor would only reach $8,050 after 25 years.
In other words, poor households would be better off with a higher rate of economic growth, even at the cost of a little more income inequality.
[page]Economic freedom increases the rate of economic growth in a nation and improves the distribution of market income. In advanced countries, economic freedom improves equity by increasing the share of market income going to the lowest income quintile and lowering the share going to the highest income quintile. The share of income going to the middle class appears to be unaffected by the amount of economic freedom that exists.
"Economic freedom raises the incomes of the poor more than government transfers."
Economic growth raises income inequality. It does so by shifting the share of market income to the highest quintile, at the expense of the other income quintiles. But the amount of increased income inequality is rather small for substantial differences in growth rates across the sample of countries used in this study. Thus, while the trade-off between equality and economic growth is relatively modest, the trade-off between economic growth and equity is large. Nations with more egalitarian distributions of market income have lower rates of economic growth.
NOTE: Nothing written here should be construed as necessarily reflecting the views of the National Center for Policy Analysis or as an attempt to aid or hinder the passage of any bill before Congress.
[page]- Those readers interested in the more technical aspects of this paper should consult the Public Choice version. Based on the paper by Gerald Scully, “Economic Freedom, Government Policy and the Trade-off Between Equity and Economic Growth,” Public Choice, Vol. 113, 2002, pages 77-96.
- Market failure is the concept that the solution produced by the market is non-optimal. Such matters include monopoly, underinvestment or overinvestment in research and development, choice of the “wrong” technology, moral hazard in insurance markets, adverse selection, information asymmetries among buyers and sellers and so on. Market failure does exist, but it is an overrated concept, and one that is used as a justification for state intervention.
- Arthur M. Okun, Equality and Efficiency (Washington, D.C.: Brookings Institution, 1975).
- From an economist’s perspective, the Dark Ages (the period from the fall of Rome in the fifth century to well into the Renaissance period) is a period of zero economic and social progress. Living standards and life expectancy (among other social indicators) remained unchanged for a millennium.
- It is well known by economists and politicians alike that taking from the rich to give to the poor does not get one very far in the income redistribution game. Confiscating Bill Gates’ fortune and giving a pro rata share to every other American would not buy a bag of groceries for each. The real money is in the middle class, because they are so numerous. That is why taxation and government benefits are concentrated in the middle class.
- The income tax was removed after the Civil War, and was not imposed on individuals again until 1913.
- British income taxation became so punitive after World War II that the tax rate exceeded 100 percent, thus requiring the wealthy to liquidate assets to pay the income tax bill. In the United States, the highest marginal tax rates were 94 percent in 1944-45 and 92 percent in 1952-53. Following the Americans (Ronald Reagan) and British (Margaret Thatcher) in the 1980s, many European nations cut their top marginal tax rates, but it is not uncommon that some still have maximum marginal rates of about 60 percent on a relatively low earnings base.
- James Gwartney, Robert Lawson and Walter Block, Economic Freedom of the World: 1975-1995 (Vancouver, B.C.: Fraser Institute, 1996).
- The countries in the sample are Australia, Belgium, Canada, Denmark, Finland, France, West Germany, Greece, Hong Kong, Ireland, Italy, Japan, South Korea, Malaysia, Mexico, Netherlands, New Zealand, Norway, Portugal, Singapore, Spain, Sweden, Taiwan, Thailand, the United Kingdom and the United States.
- The data on the Gini coefficients come from Klaus Deininger and Lyn Squire, “A new data set measuring income inequality,” World Bank Economic Review, Vol.10, 1996, pages 565-91.
- An income quintile is the percentage share of income held by 20 percent of the population. The lowest income quintile is the income share of the 20 percent with the lowest income; the highest income quintile is the income share of those with the most income.
- A similar finding of the effect of economic liberty on the share of income of the highest income quintile for 70 nations is found in Gerald W. Scully, “Rights, Equity and Economic Efficiency,” Public Choice, Volume 68, 1991, pages 195-215.
- Statistical Abstract of the United States 1990 (Washington, D.C.: U.S. Government Printing Office, 1990), page 449.
Gerald W. Scully is a senior fellow with the National Center for Policy Analysis and professor emeritus of economics in the School of Management at the University of Texas at Dallas. His articles have appeared in the American Economic Review, the Journal of Political Economy, the Journal of Law and Economics, Public Choice and other scholarly journals. Dr. Scully is also an expert on the economics of sports. His most recent book is The Market Structure of Sports.